Chapter 6 Data Visualization
6.1 Matplotlib
img = np.empty((20,30,3))
img[:, :10] = [0, 0.6, 0]
img[:, 10:20] = [1, 1, 1]
img[:, 20:] = [0.6, 0, 0]
plt.imshow(img)
plt.show()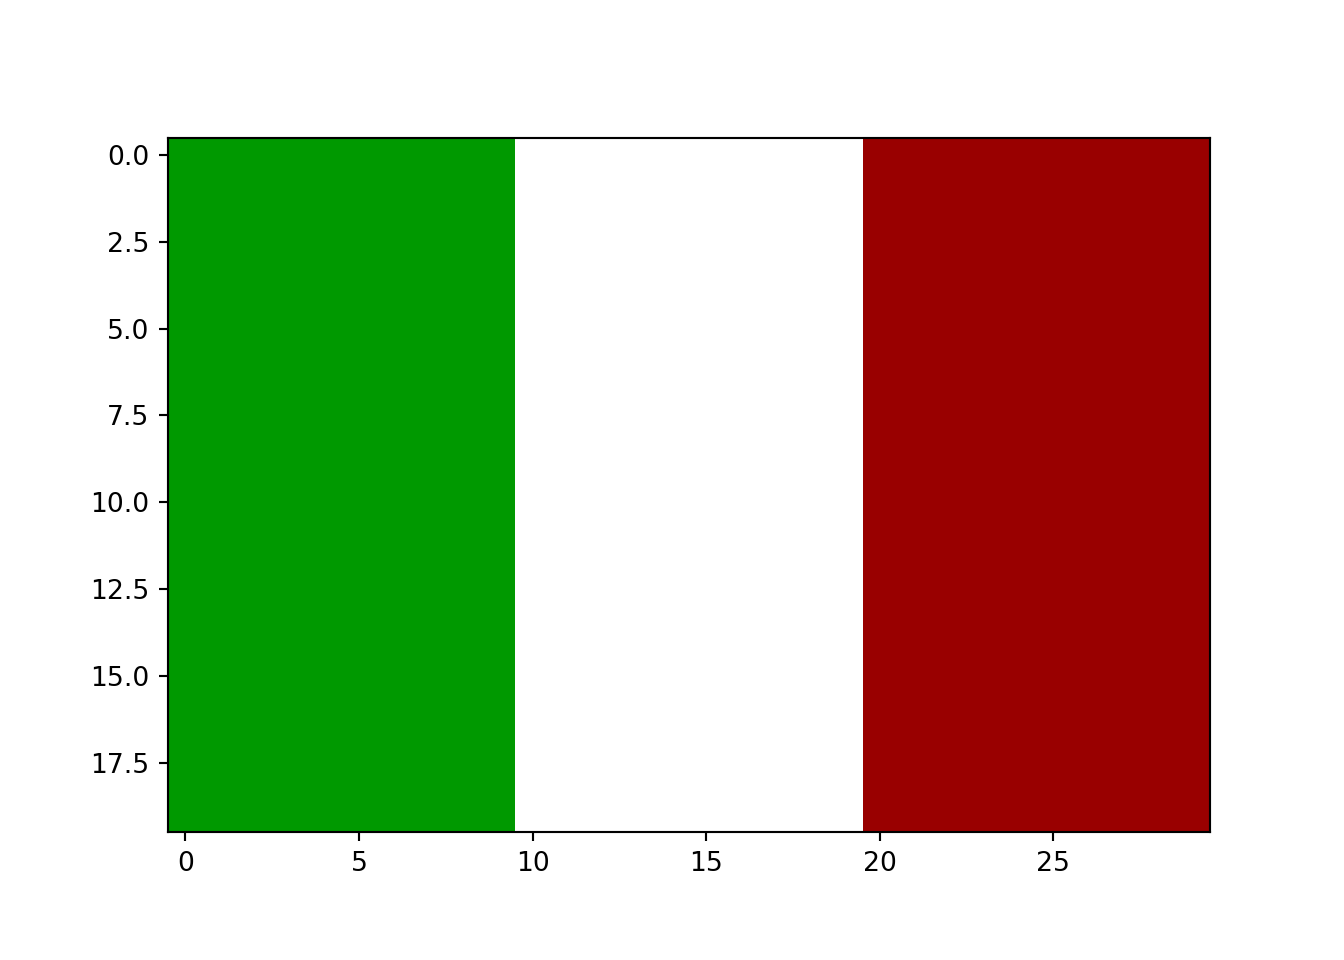
6.2 Exploratory Visualization
Suppose we want to have a look at the distribution of our dataset
Detect how each attribute correlates with the scatter_matrix() function, applied to a subset of attributes. It draws a matrix of scatter plot.