Técnicas de Machine Learning
Alessio Crisafulli Carpani
Máster en Minería de Datos e Inteligencia de Negocios
Técnicas de Machine Learning
Este trabajo está orientado a predecir una variable binaria o continua a través de diferentes algoritmos de clasificación o estimación relaccionados con árboles y otros.
En este caso, he querido explorar un dataset de RRHH desarollado por IBM. Es posible descargarlo aquí:
El objetivo de este informe es predecir el índice de deserción de los empleados, identificando también las causas que más lo influencian.
Este es un conjunto de datos ficticio creado por científicos de datos. Por esta razón espero métricas de los modelos elevadas
Abstracto
A lo largo de esta análisis, he analizado el conjunto de datos IBM Employee Attrition para explorar las causas principales de la deserción en una empresa. Primero, a través de un análisis exploratorio, me he asegurado que los datos esteban limpios. En esta etapa, me dí cuenta que los datos tenían un problema de desbalanceo entre las clases de la variable dependiente, para arreglar este problema he ampliado la muestra de la clase menor.
Una vez que los datos estaban listos, he empezado la modelización del árbol de decisión, bagging, random forest, gradient boosting machine (GBM) y extreme gradient boosting machine (XGBM). Para cada técnica, mi flujo de trabajo ha sido lo siguiente:
Tunear los parámetros de cada modelo, con la función
traindel paquetecaret, empleando un bucle cuando la función no permite el control de unos parámetros y utilizando computación paralela sobre tres procesadores.Entender el andamiento del ajuste para los distintos parámetros tuneados a través unos gráficos.
- Además para el bagging y random forest he visualizado el error de out-of-bag, para entender el andamiento a medida que aumentaban las interacciones de los árboles. A través este gráfico he podido reducir la complejidad de mi modelo final.
Después haber elegido los parámetros mejores, he ajustado el modelo final, visualizando la matriz de confusión y las variables más influyentes para cada modelo.
Una vez ajustadas las técnicas de árboles, he ajustado otra vez los modelos con validación cruzada repetida esta vez, para comparar las respectivas tasa de fallo y la área abajo la curva ROC, a través de un grafo de caja y bigote incluyendo como modelo de referencia una regresión logística.
Una vez encontrado el modelo ganador, he decidido crear un grafo de barras apiladas para obtener las variables más influyentes según los distintos modelos. A partir de estas, he creado un nuevo conjunto entrenamiento/test, con el cual voy a realizar otras técnicas de aprendizaje automático:
- Support Vector Machines, con kernel:
- Lineal
- Polynomial
- Radial
- Bagging del SVM Lineal
- Boosting
- Stacking de:
- Gradient Boosting Machine
- SVM Radial
- XGBoost
1 Descripción de los datos
- El conjunto de datos: 1470 observaciones, 35 variables.
- Tipo de variables: Tenemos ambos variables categorícas y numerícas. La variable objecto de ínteres, Attrition, es una variable binaria que toma valores Yes o No, dependiendo si el empleado se ha marchado de la impresa.
Unas columnas están en escala 1-5, dale al nombre de la columna marcada en rojo para visualizar un popup con la descripción.
as.data.frame(cbind(Variable = names(data), Description = c("Edad", "Si ha dejado la empresa o no",
    "Si viaja raramente, poco, mucho por trabajo", "Salario diarío", "El departamiento de la empresa",
    "Cuanto está lejo de su casa", "Nivel de Education", "Numero de empleado", "ID",
    "Satisfacción entorno", "Género", "Salario por hora", "Participación en el trabajo",
    "Nivel de trabajo", "Rol trabajo", "Satisfacción al trabajo", "Estado civil",
    "Salario bruto mensual", "Tasa mensual", "Con cuantas empresas ha trabajado",
    "Si es mayor de 18 años", "Si trabaja más del normal", "Porcentaje aumento salario",
    "Calificación de desempeño", "Satisfacción de la relación", "Horas estandar de trabajo",
    "Retribuciones", "Total años de trabajo", "Cuantas veces ha hecho formación el año pasado",
    "Balnceo entre vida y trabajo", "Años en la empresa", "Años en este rol", "Años desde ultima promocción",
    "Años con manager actual"))) %>%
    kable(format = "html", align = c(rep("l", 2))) %>%
    row_spec(0, font_size = 14) %>%
column_spec(1, bold = T)| Variable | Description |
|---|---|
| Age | Edad |
| Attrition | Si ha dejado la empresa o no |
| BusinessTravel | Si viaja raramente, poco, mucho por trabajo |
| DailyRate | Salario diarío |
| Department | El departamiento de la empresa |
| DistanceFromHome | Cuanto está lejo de su casa |
| Education | Nivel de Education |
| EducationField | Numero de empleado |
| EmployeeCount | ID |
| EmployeeNumber | Satisfacción entorno |
| EnvironmentSatisfaction | Género |
| Gender | Salario por hora |
| HourlyRate | Participación en el trabajo |
| JobInvolvement | Nivel de trabajo |
| JobLevel | Rol trabajo |
| JobRole | Satisfacción al trabajo |
| JobSatisfaction | Estado civil |
| MaritalStatus | Salario bruto mensual |
| MonthlyIncome | Tasa mensual |
| MonthlyRate | Con cuantas empresas ha trabajado |
| NumCompaniesWorked | Si es mayor de 18 años |
| Over18 | Si trabaja más del normal |
| OverTime | Porcentaje aumento salario |
| PercentSalaryHike | Calificación de desempeño |
| PerformanceRating | Satisfacción de la relación |
| RelationshipSatisfaction | Horas estandar de trabajo |
| StandardHours | Retribuciones |
| StockOptionLevel | Total años de trabajo |
| TotalWorkingYears | Cuantas veces ha hecho formación el año pasado |
| TrainingTimesLastYear | Balnceo entre vida y trabajo |
| WorkLifeBalance | Años en la empresa |
| YearsAtCompany | Años en este rol |
| YearsInCurrentRole | Años desde ultima promocción |
| YearsSinceLastPromotion | Años con manager actual |
| YearsWithCurrManager | Edad |
Desbalanceo entre los datos: 1237 (84% de los casos) empleados no han dejado la empresa, mientras 237 (16% of casos) lo han hecho. Este desbalanceo tiene que ser ajustado, mediante unas técnicas adecuadas, para no sobreajustar el modelo.
2 Analísis Exploratorio de Datos (EDA)
2.1 Visualización de Datos
2.1.1 Variables Continuas
library(kableExtra)
library(modelsummary)

datasummary_skim(data, type = "numeric", title = "Variables Numericas") %>%
    remove_column(columns = c(2, 3)) %>%
    column_spec(1, bold = T) %>%
    kable_material() %>%
    kable_styling(bootstrap_options = c("condensed", "responsive")) %>%
scroll_box(width = "100%", height = "400px")| Mean | SD | Min | Median | Max | ||
|---|---|---|---|---|---|---|
| Age | 36.9 | 9.1 | 18.0 | 36.0 | 60.0 | |
| DailyRate | 802.5 | 403.5 | 102.0 | 802.0 | 1499.0 | |
| DistanceFromHome | 9.2 | 8.1 | 1.0 | 7.0 | 29.0 | |
| EmployeeCount | 1.0 | 0.0 | 1.0 | 1.0 | 1.0 | |
| EmployeeNumber | 1024.9 | 602.0 | 1.0 | 1020.5 | 2068.0 | |
| EnvironmentSatisfaction | 2.7 | 1.1 | 1.0 | 3.0 | 4.0 | |
| HourlyRate | 65.9 | 20.3 | 30.0 | 66.0 | 100.0 | |
| JobInvolvement | 2.7 | 0.7 | 1.0 | 3.0 | 4.0 | |
| JobLevel | 2.1 | 1.1 | 1.0 | 2.0 | 5.0 | |
| JobSatisfaction | 2.7 | 1.1 | 1.0 | 3.0 | 4.0 | |
| MonthlyIncome | 6502.9 | 4708.0 | 1009.0 | 4919.0 | 19999.0 | |
| MonthlyRate | 14313.1 | 7117.8 | 2094.0 | 14235.5 | 26999.0 | |
| NumCompaniesWorked | 2.7 | 2.5 | 0.0 | 2.0 | 9.0 | |
| PercentSalaryHike | 15.2 | 3.7 | 11.0 | 14.0 | 25.0 | |
| PerformanceRating | 3.2 | 0.4 | 3.0 | 3.0 | 4.0 | |
| RelationshipSatisfaction | 2.7 | 1.1 | 1.0 | 3.0 | 4.0 | |
| StandardHours | 80.0 | 0.0 | 80.0 | 80.0 | 80.0 | |
| StockOptionLevel | 0.8 | 0.9 | 0.0 | 1.0 | 3.0 | |
| TotalWorkingYears | 11.3 | 7.8 | 0.0 | 10.0 | 40.0 | |
| TrainingTimesLastYear | 2.8 | 1.3 | 0.0 | 3.0 | 6.0 | |
| WorkLifeBalance | 2.8 | 0.7 | 1.0 | 3.0 | 4.0 | |
| YearsAtCompany | 7.0 | 6.1 | 0.0 | 5.0 | 40.0 | |
| YearsInCurrentRole | 4.2 | 3.6 | 0.0 | 3.0 | 18.0 | |
| YearsSinceLastPromotion | 2.2 | 3.2 | 0.0 | 1.0 | 15.0 | |
| YearsWithCurrManager | 4.1 | 3.6 | 0.0 | 3.0 | 17.0 |
library(GGally)
ggpairs(data, mapping = aes(color = Attrition), columns = c("MonthlyIncome", "JobSatisfaction",
    "EnvironmentSatisfaction", "DistanceFromHome", "DailyRate", "Age", "PercentSalaryHike"),
    upper = list(continuous = "barDiag"), lower = list(continuous = wrap("points",
        alpha = 0.5, size = 0.1)), title = "Matriz de Visualización Variables Continuas",
    legend = 1, showStrips = T) + theme_minimal(base_size = 10, base_family = "Times") +
    theme(title = element_text(face = "bold"), legend.title = element_text(face = "bold"),
        legend.position = "bottom") + scale_fill_manual(values = c("#2E45B8", "#D6DBF5")) +
    scale_color_manual(values = c("#2E45B8", "#D6DBF5"))
Numerical Variables
Podemos notar como las variables no tienen una distribución lineal, entonces me espero que las técnicas des árboles van a funcionar bien con estos tipo de datos. También se nota que no hay separación lineal.
2.1.2 Variables Categóricas
datasummary_skim(data, type = "categorical", title = "Variables Categóricas") %>%
    column_spec(1, bold = T) %>%
    column_spec(2, italic = T) %>%
    kable_material() %>%
    kable_styling(bootstrap_options = c("condensed", "responsive")) %>%
scroll_box(width = "100%", height = "400px")| N | % | ||
|---|---|---|---|
| Attrition | Yes | 237 | 16.1 |
| No | 1233 | 83.9 | |
| BusinessTravel | Travel_Rarely | 1043 | 71.0 |
| Travel_Frequently | 277 | 18.8 | |
| Non-Travel | 150 | 10.2 | |
| Department | Sales | 446 | 30.3 |
| Research & Development | 961 | 65.4 | |
| Human Resources | 63 | 4.3 | |
| Education | 2 | 282 | 19.2 |
| 1 | 170 | 11.6 | |
| 4 | 398 | 27.1 | |
| 3 | 572 | 38.9 | |
| 5 | 48 | 3.3 | |
| EducationField | Life Sciences | 606 | 41.2 |
| Other | 82 | 5.6 | |
| Medical | 464 | 31.6 | |
| Marketing | 159 | 10.8 | |
| Technical Degree | 132 | 9.0 | |
| Human Resources | 27 | 1.8 | |
| Gender | Female | 588 | 40.0 |
| Male | 882 | 60.0 | |
| JobRole | Sales Executive | 326 | 22.2 |
| Research Scientist | 292 | 19.9 | |
| Laboratory Technician | 259 | 17.6 | |
| Manufacturing Director | 145 | 9.9 | |
| Healthcare Representative | 131 | 8.9 | |
| Manager | 102 | 6.9 | |
| Sales Representative | 83 | 5.6 | |
| Research Director | 80 | 5.4 | |
| Human Resources | 52 | 3.5 | |
| MaritalStatus | Single | 470 | 32.0 |
| Married | 673 | 45.8 | |
| Divorced | 327 | 22.2 | |
| Y | 1470 | 100.0 | |
| OverTime | Yes | 416 | 28.3 |
| No | 1054 | 71.7 |
theme_set(
    theme_minimal(base_family = 'Times',
                                base_size = 10) +
    theme(
    legend.position = "none",
    panel.grid.minor.x = element_blank(),
    panel.grid.major.y = element_blank(),
    axis.text.x = element_text(color = "gray60",
                                                         size = 8),
    axis.title.x = element_blank(),
    )
)

colors=c("#2E45B8","#D6DBF5")


library("cowplot")
plot_grid(
ggdraw() + draw_label("Categorical Variables of Data with Attrition", fontface = "bold"),

plot_grid(
    ggplot(data,aes(fill=Attrition,x=Gender)) +
    geom_bar(position="dodge2",alpha=0.8,color="black") +
    scale_fill_manual(values=colors) + coord_flip(),

    ggplot(data,aes(fill=Attrition,x=Department))+geom_bar(position="fill",alpha=0.8,color="black")+scale_fill_manual(values=colors)+coord_flip(),

  ggplot(data,aes(fill=Attrition, x=JobRole))+geom_bar(position="fill",alpha=0.8,color="black")+scale_fill_manual(values=colors)+coord_flip(),

    ggplot(data,aes(fill=Attrition, x=Education))+geom_bar(position="fill",alpha=0.8,color="black")+scale_fill_manual(values=colors)+coord_flip(),

    ggplot(data,aes(fill=Attrition, x=OverTime))+geom_bar(position="fill",alpha=0.8,color="black")+scale_fill_manual(values=colors)+coord_flip(),

    ggplot(data,aes(fill=Attrition, x=EducationField))+geom_bar(position="fill",alpha=0.8,color="black")+scale_fill_manual(values=colors)+coord_flip(),

    ncol = 2),

rel_heights = c(0.1, 1, 0.2),

get_legend(ggplot(data,aes(fill=Attrition,x=Gender))+geom_bar(position="fill",alpha=0.8,color="black")+scale_fill_manual(values=colors)+coord_flip()+ theme(legend.position = "top")),
ncol = 1)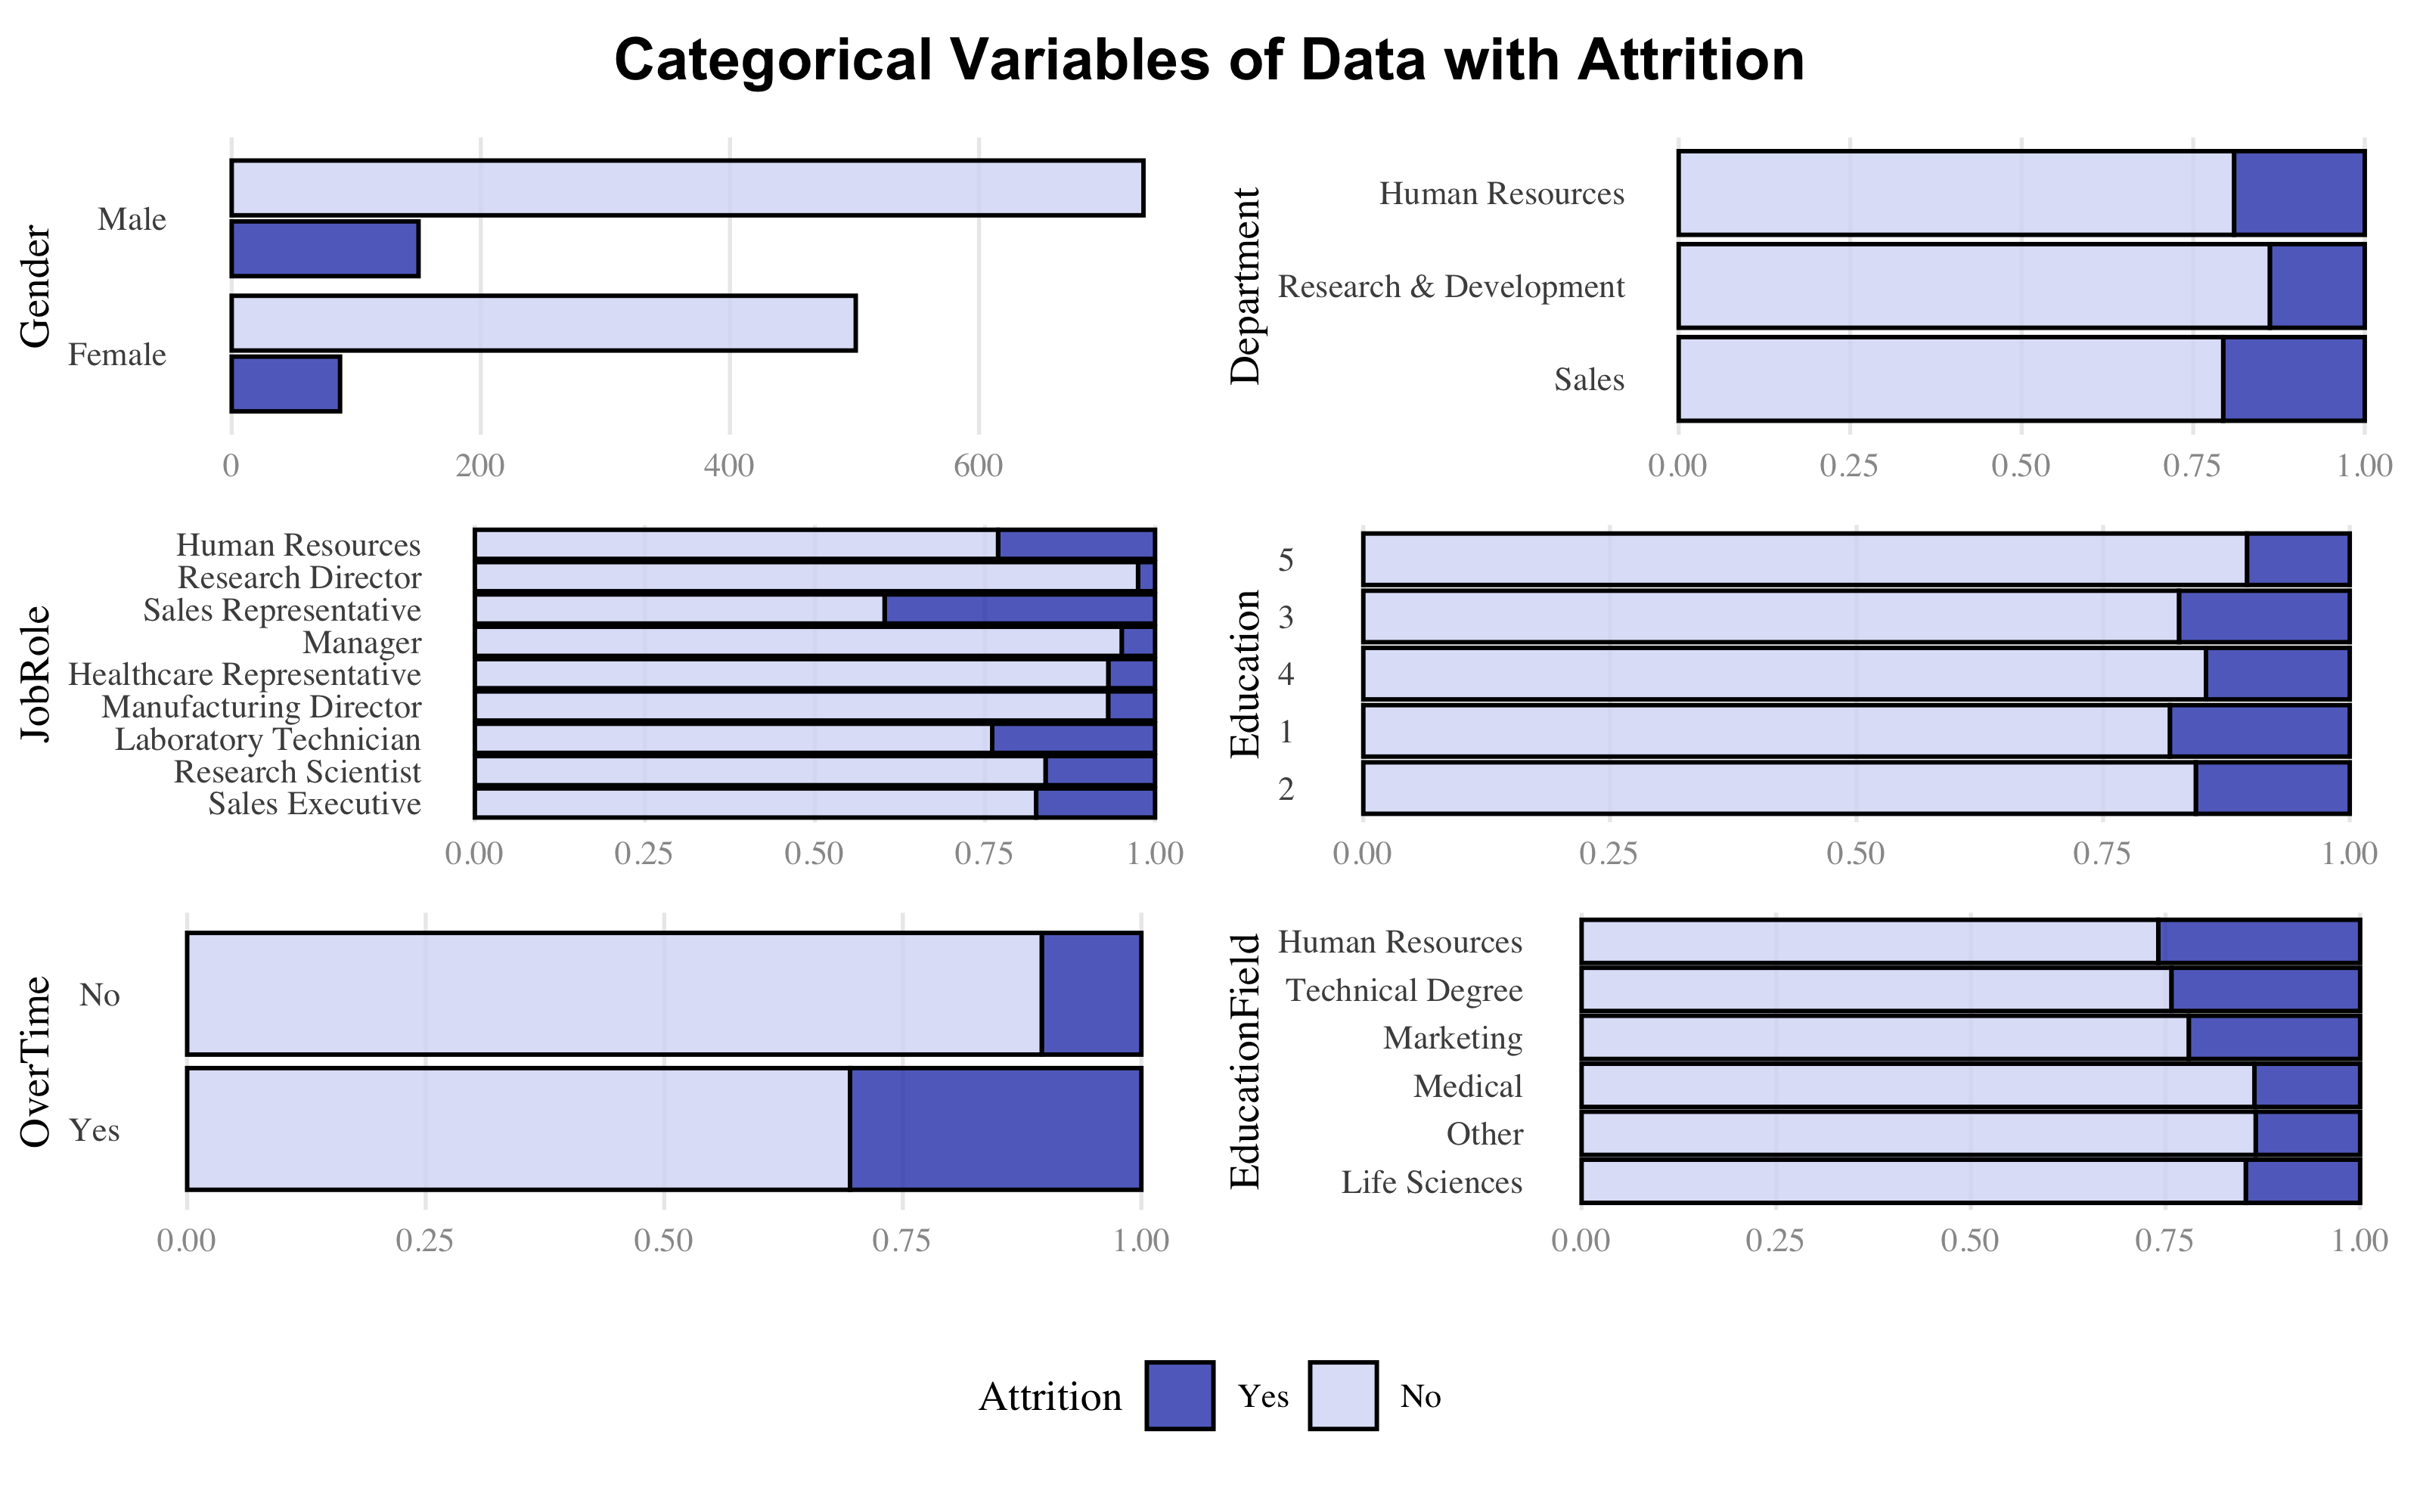
Categorical Variables
2.2 Datos Faltantes & Duplicados
r >      Missings Duplicados
r > [1,]        0          0
No hay ni datos faltantes ni filas duplicadas
- Age, DailyRate, DistanceFromHome, HourlyRate, MonthlyRate, PercentSalaryHike no tienen outliers.
- NumCompaniesWorked, TrainingTimesLastYear, YearsWithCurrManager, YearsInCurrentRole tienen un moderado numero de outliers.
- MonthlyIncome, TotalWorkingYears, YearsAtCompany, YearsSinceLastPromotion tienen un largo numero de outliers.
No haré mas consideraciones en cuanto, de todas formas, los outliers no afectan los modelos de árboles que voy a plantear.
2.3 Análisis de la Correlación
Este parte de la análisis, me proporcionará evidencias sobre la correlación entre los regresores.
corr_mx = as.matrix((cor(data[, sapply(data, is.numeric)] %>%
    select(-StandardHours, -EmployeeCount))))

corrplot::corrplot(corr_mx, method = "square", type = "lower", diag = T, tl.col = "#2E45B8",
    tl.cex = 1.3, col = painter::Palette("#D6DBF5", "#4055BE", 10))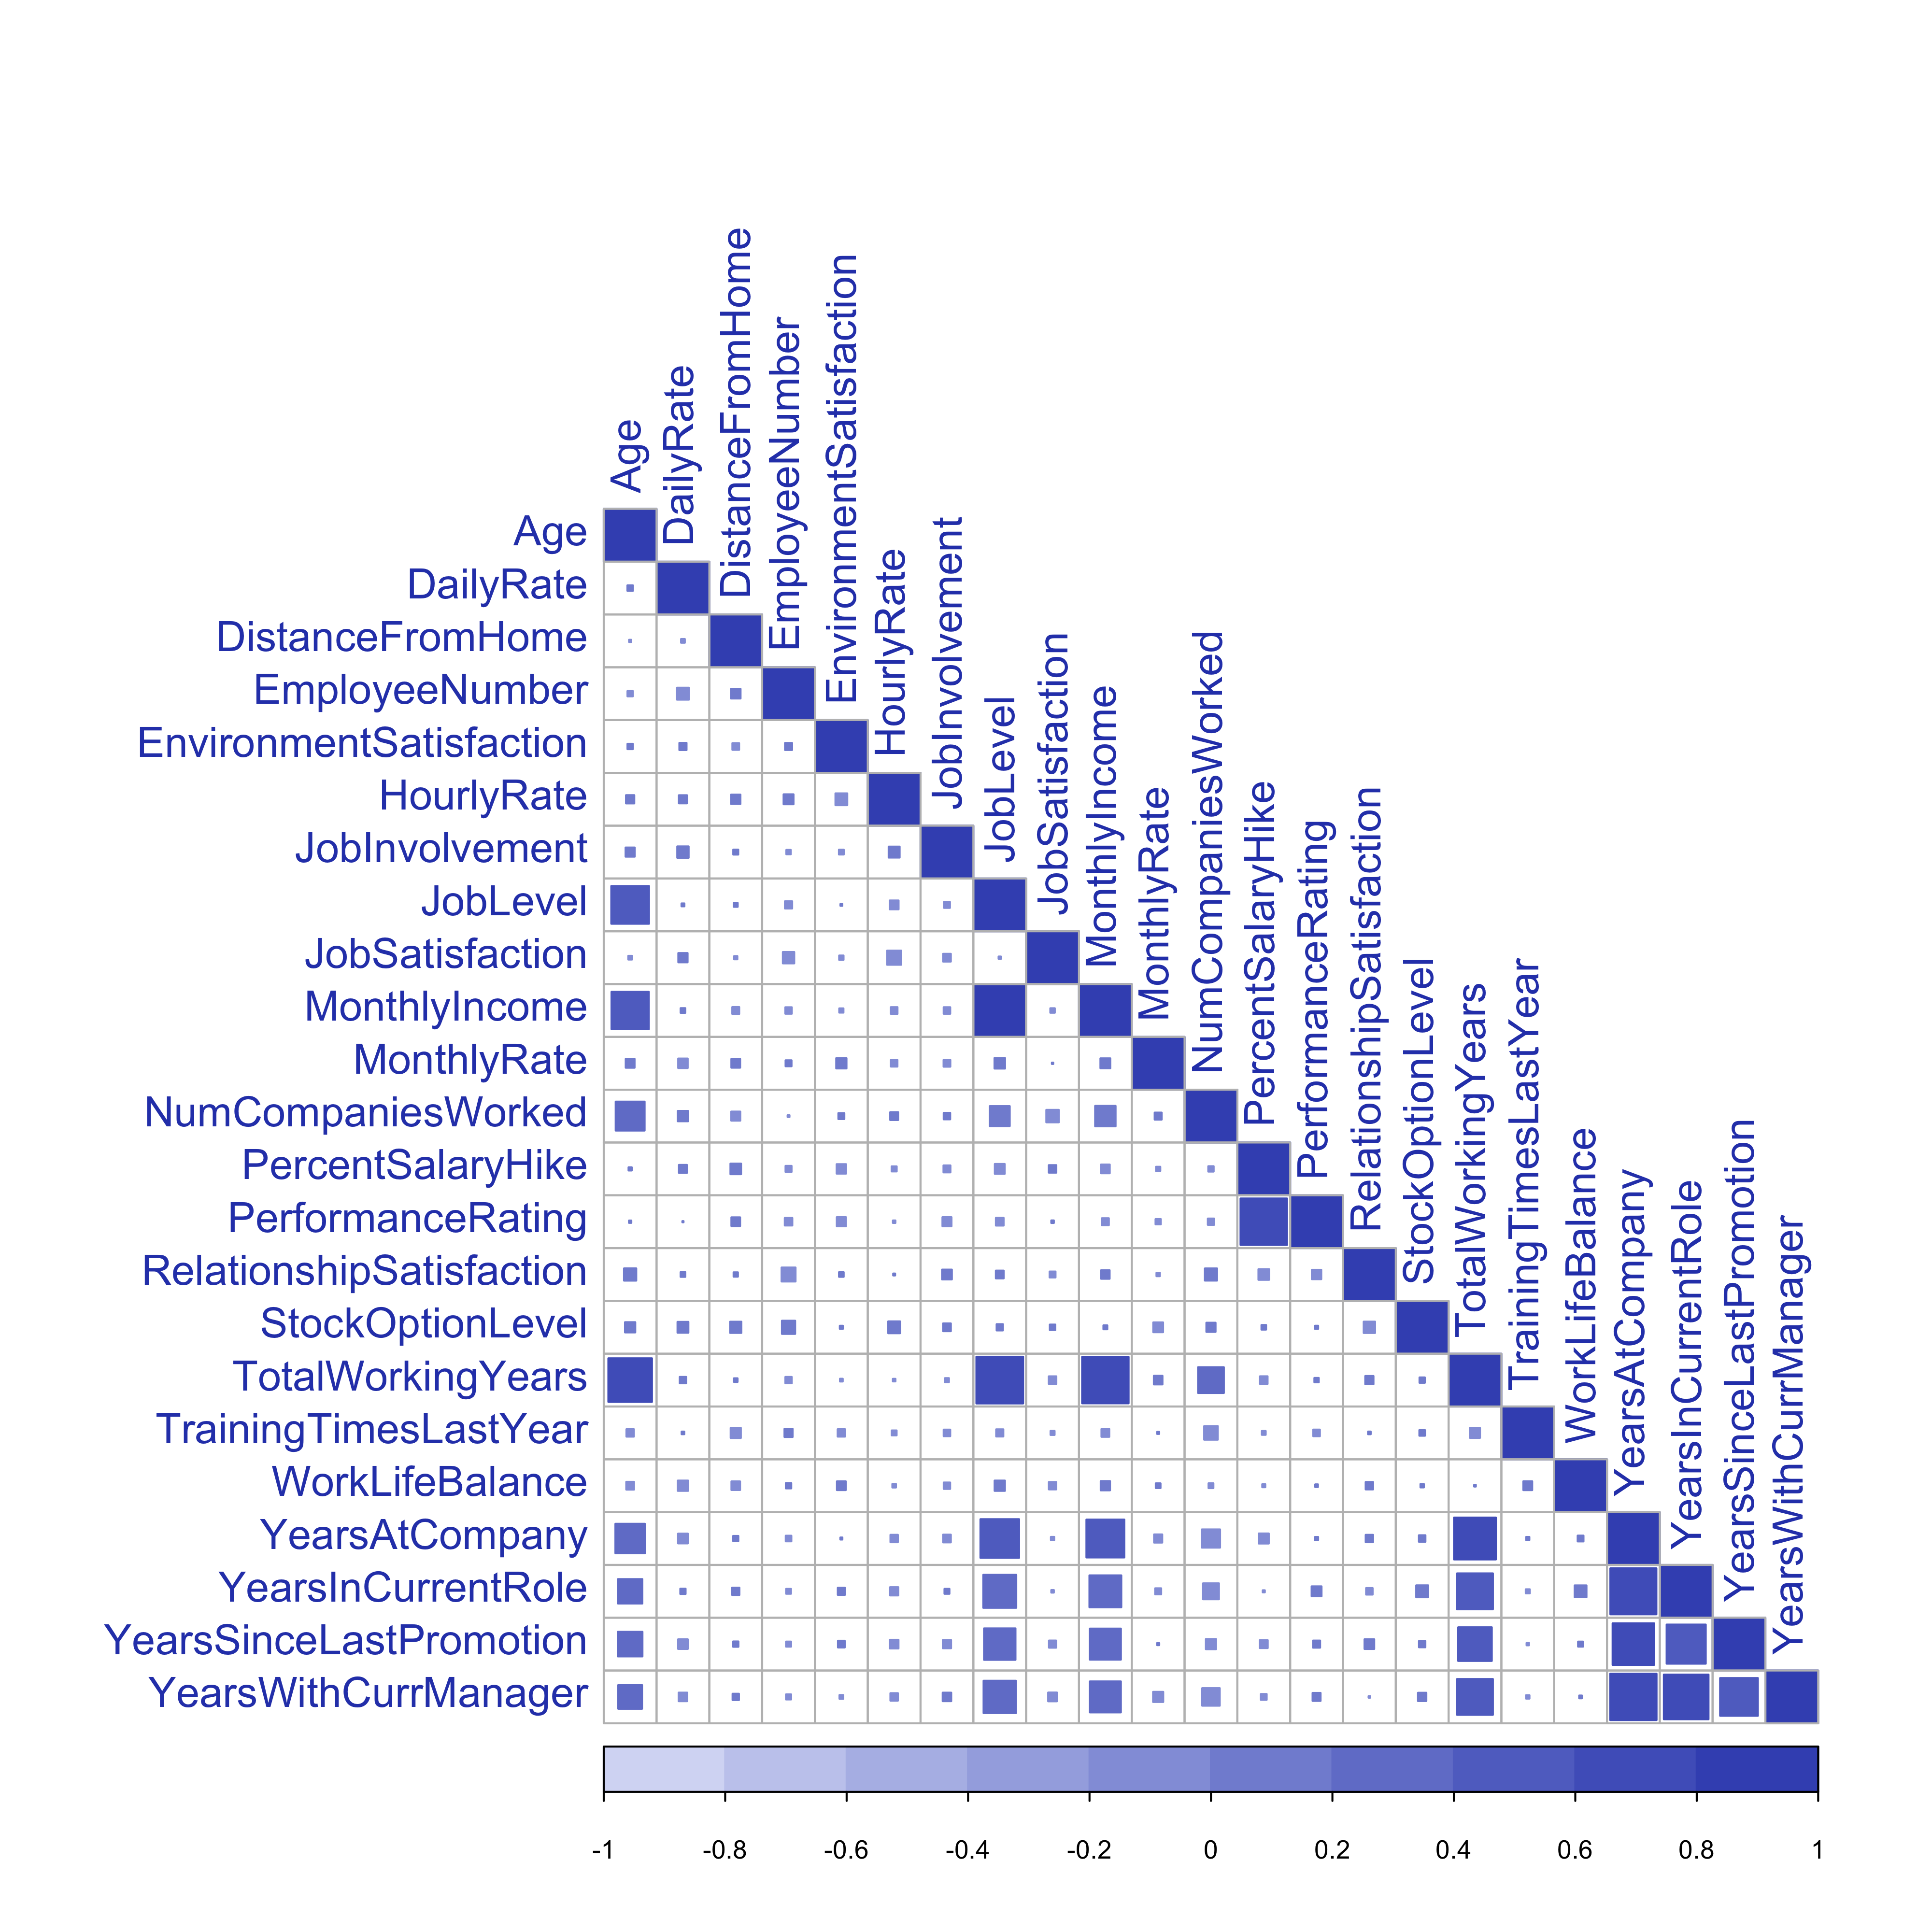
Matriz de Correlación
MonthlyIncome está muy correlada con JobLevel
La correlacíon entre TotalWorkingYears y JobLevel es 0.78, que también está bastante alta.
La variable PercentSalaryHike tiene correlacíon elevada con PerformanceRating
El conjunto de variables YearsSinceLastPromotion, YearsInCurrentRole, YearsWithCurrManager y YearsAtCompany, están correladas entre ellas mismas y entonces elegiré solo dos de ellas para reducir la complejidad de los árboles
Todas las demás tienen una correlacíon menor que 0.80.
3 Features Engineering
3.1 Selección de Variables
Unas variables no explican variabilidad en el modelo planteado. Estas variables son:
- EmployeeNumber: denota el numero de identificación del empleado.
- EmployeeCount: este es justo una cuenta del empleado y entonces toma siempre valor igual a 1.
- Over18: esta variable describe si el empleado es mayor de 18 años. Toma valor ‘Yes’ en todos los casos.
- StandardHours: el numero estándar de horas de trabajo por semana. Tiene valor constante de 80.
Luego, como ya dicho para reducir la complejidad de los árboles, quitaré 2, sobre 4, variables que proporcionan informaciones sobre los años de trabajo en la empresa y también quitaré MonthlyRate en cuanto ya tengo la variable DailyRate que simplemente está explicada en otra unidad. Por estas razones, quitaré estas variables de mi conjunto de datos.
data %<>%
    select(-EmployeeNumber, -EmployeeCount, -Over18, -StandardHours, -TrainingTimesLastYear,
        -YearsWithCurrManager, -YearsInCurrentRole, -MonthlyRate)
También el conjunto de datos está muy bueno para trabajar, así que no necesitaré crear otras variables a partir de las que ya tengo.
No emplearé otros algoritmos en cuanto las técnicas de árboles ya desarrollan los modelos sobre las variables más influyentes, pero enseguida implementaré otras técnicas de ML spara el conjunto con las variables más importantes.
3.2 Data Preprocessing
3.2.1 Dummies
3.2.2 Estandarización de Variables
La regresión logística y los algoritmos basados en árboles, como el Decision Tree, el Random Forest y el Gradient Boosting, no son sensibles a la magnitud de las variables. Por lo tanto, no es necesaria la estandarización antes de ajustar este tipo de modelos.
3.3 Entrenamiento / Prueba
Stratified Train-Test Splits
Como el dataset no tiene un numero balanceado de ejemplos por cada clase de la variable dependiente, voy a repartir los datos entre los conjunto train y test, de una manera que preserva el mismo numero de ejemplos en cada clase como el conjunto original. Este procedimiento es llamado como muestreo train-test estratificado.
Por defecto, la función caret createDataPartition, hace la estratificación de esta manera.
library(caret)
trainIndex <- createDataPartition(datos$Attrition, p = 0.8, list = FALSE, times = 1)
Train <- datos[trainIndex, ]
Test <- datos[-trainIndex, ]

rm(trainIndex)
rbind(Test = dim(Train), Train = dim(Test)) %>%
    kable(caption = "Partición en Entrenamiento y Prueba", col.names = c("Observaciones",
"Variables"))| Observaciones | Variables | |
|---|---|---|
| Test | 1177 | 52 |
| Train | 293 | 52 |
No obstante, tenemos todavía que lidiar con el desbalanceo.
3.4 Desbalanceo de Datos
El paquete caret tiene una función upSample, que reajusta las frecuencias de las clases, haciendo un muestreo con reemplazo para que la distribución en cada clase sea igual.
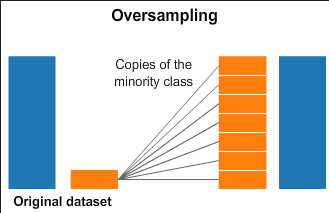
Up-Sampling Technique
predictors = names(Train)[names(Train) != "Attrition"]

upTrain <- upSample(x = Train[, predictors], y = Train$Attrition, list = FALSE, yname = "Attrition")

upTrain %<>%
    janitor::clean_names()
Test %<>%
    janitor::clean_names()
predictors = names(upTrain)[names(upTrain) != "attrition"]
Ahora voy a comprobar los numeros de observaciones en cada clase:
knitr::kables(format = "html", list(kable(table(Train$Attrition), caption = "Imbalanced Data",
    col.names = c("Class", "N")), kable(table(upTrain$attrition), caption = "Balanced Data",
    col.names = c("Class", "N"), position = "float_right")))
|
|
4 Ajuste del Modelo
4.1 Remuestreo
Primero, para comprobar la validez de los resultados del modelo, voy a emplear validación cruzada; esta técnica me va a garantir que los resultados son independientes de la partición de los datos entre entrenamiento y prueba, a través el uso de 5 subconjuntos aleatorios. Para la reproducibilidad de estos algoritmos, he fijado la semilla de aleatorización.
4.2 Modelo de Referencia
Tenemos que establecer primero un modelo de referencia para comparar si los modelos que voy a emplear aportan mejoras consistentes. Para ello, he ajustado un modelo de regresión logística.
# Confusion Matrix ----
source("files/ConfusionMatrix.R")
draw_confusion_matrix(confusionMatrix(logi$pred$pred, logi$pred$obs), "#D6DBF5",
    "#2E45B8")

roc(response = logi$pred$obs, predictor = logi$pred$Yes, quiet = T) %>%
    ggroc(colour = "#2E45B8", size = 0.8) + annotate("text", x = 0.08, y = 0.92,
    label = "bold(AUC): 0.86", family = "Times", parse = TRUE) + hrbrthemes::theme_ipsum(ticks = T,
    base_family = "Times", base_size = 10) + labs(title = "ROC Curve", subtitle = "Modelo de Referencia: Regression Logistica") +
    theme(legend.position = "none", panel.background = element_rect(color = "#3b454a"),
        title = element_text(face = "bold"), axis.title.y = element_text(size = 10),
        axis.text.x = element_text(face = "bold", colour = "#3D3D3D", size = 10))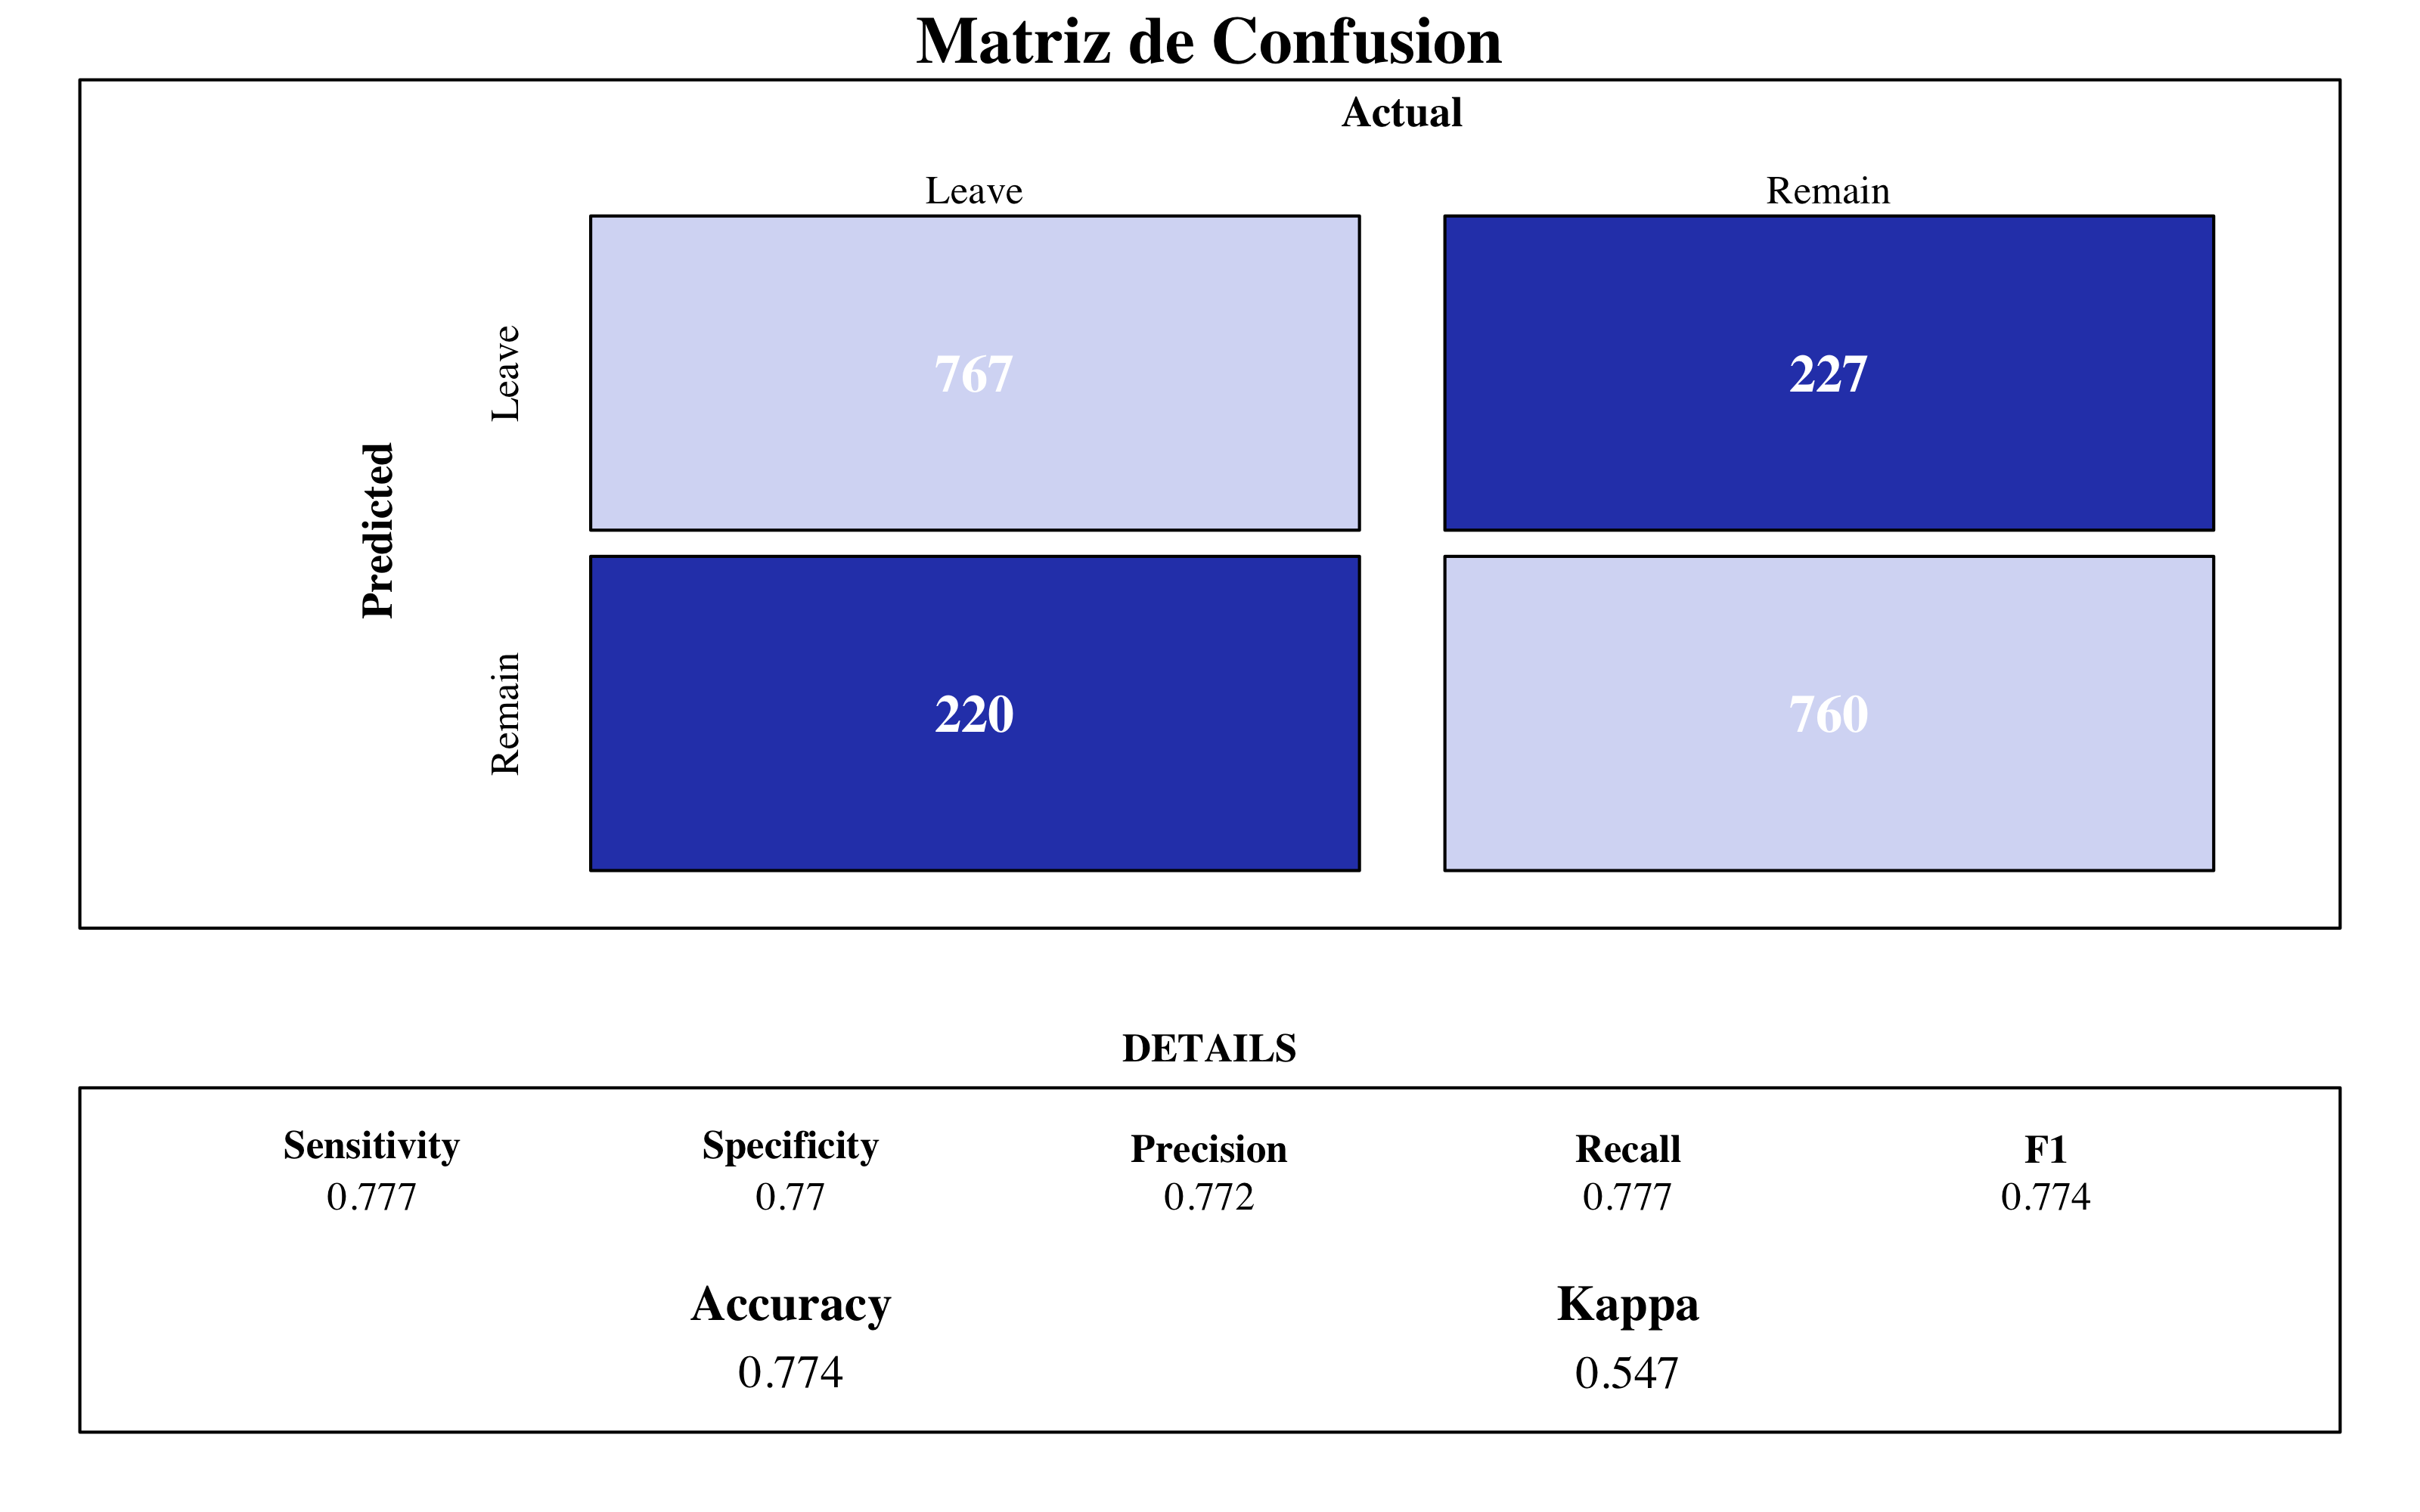
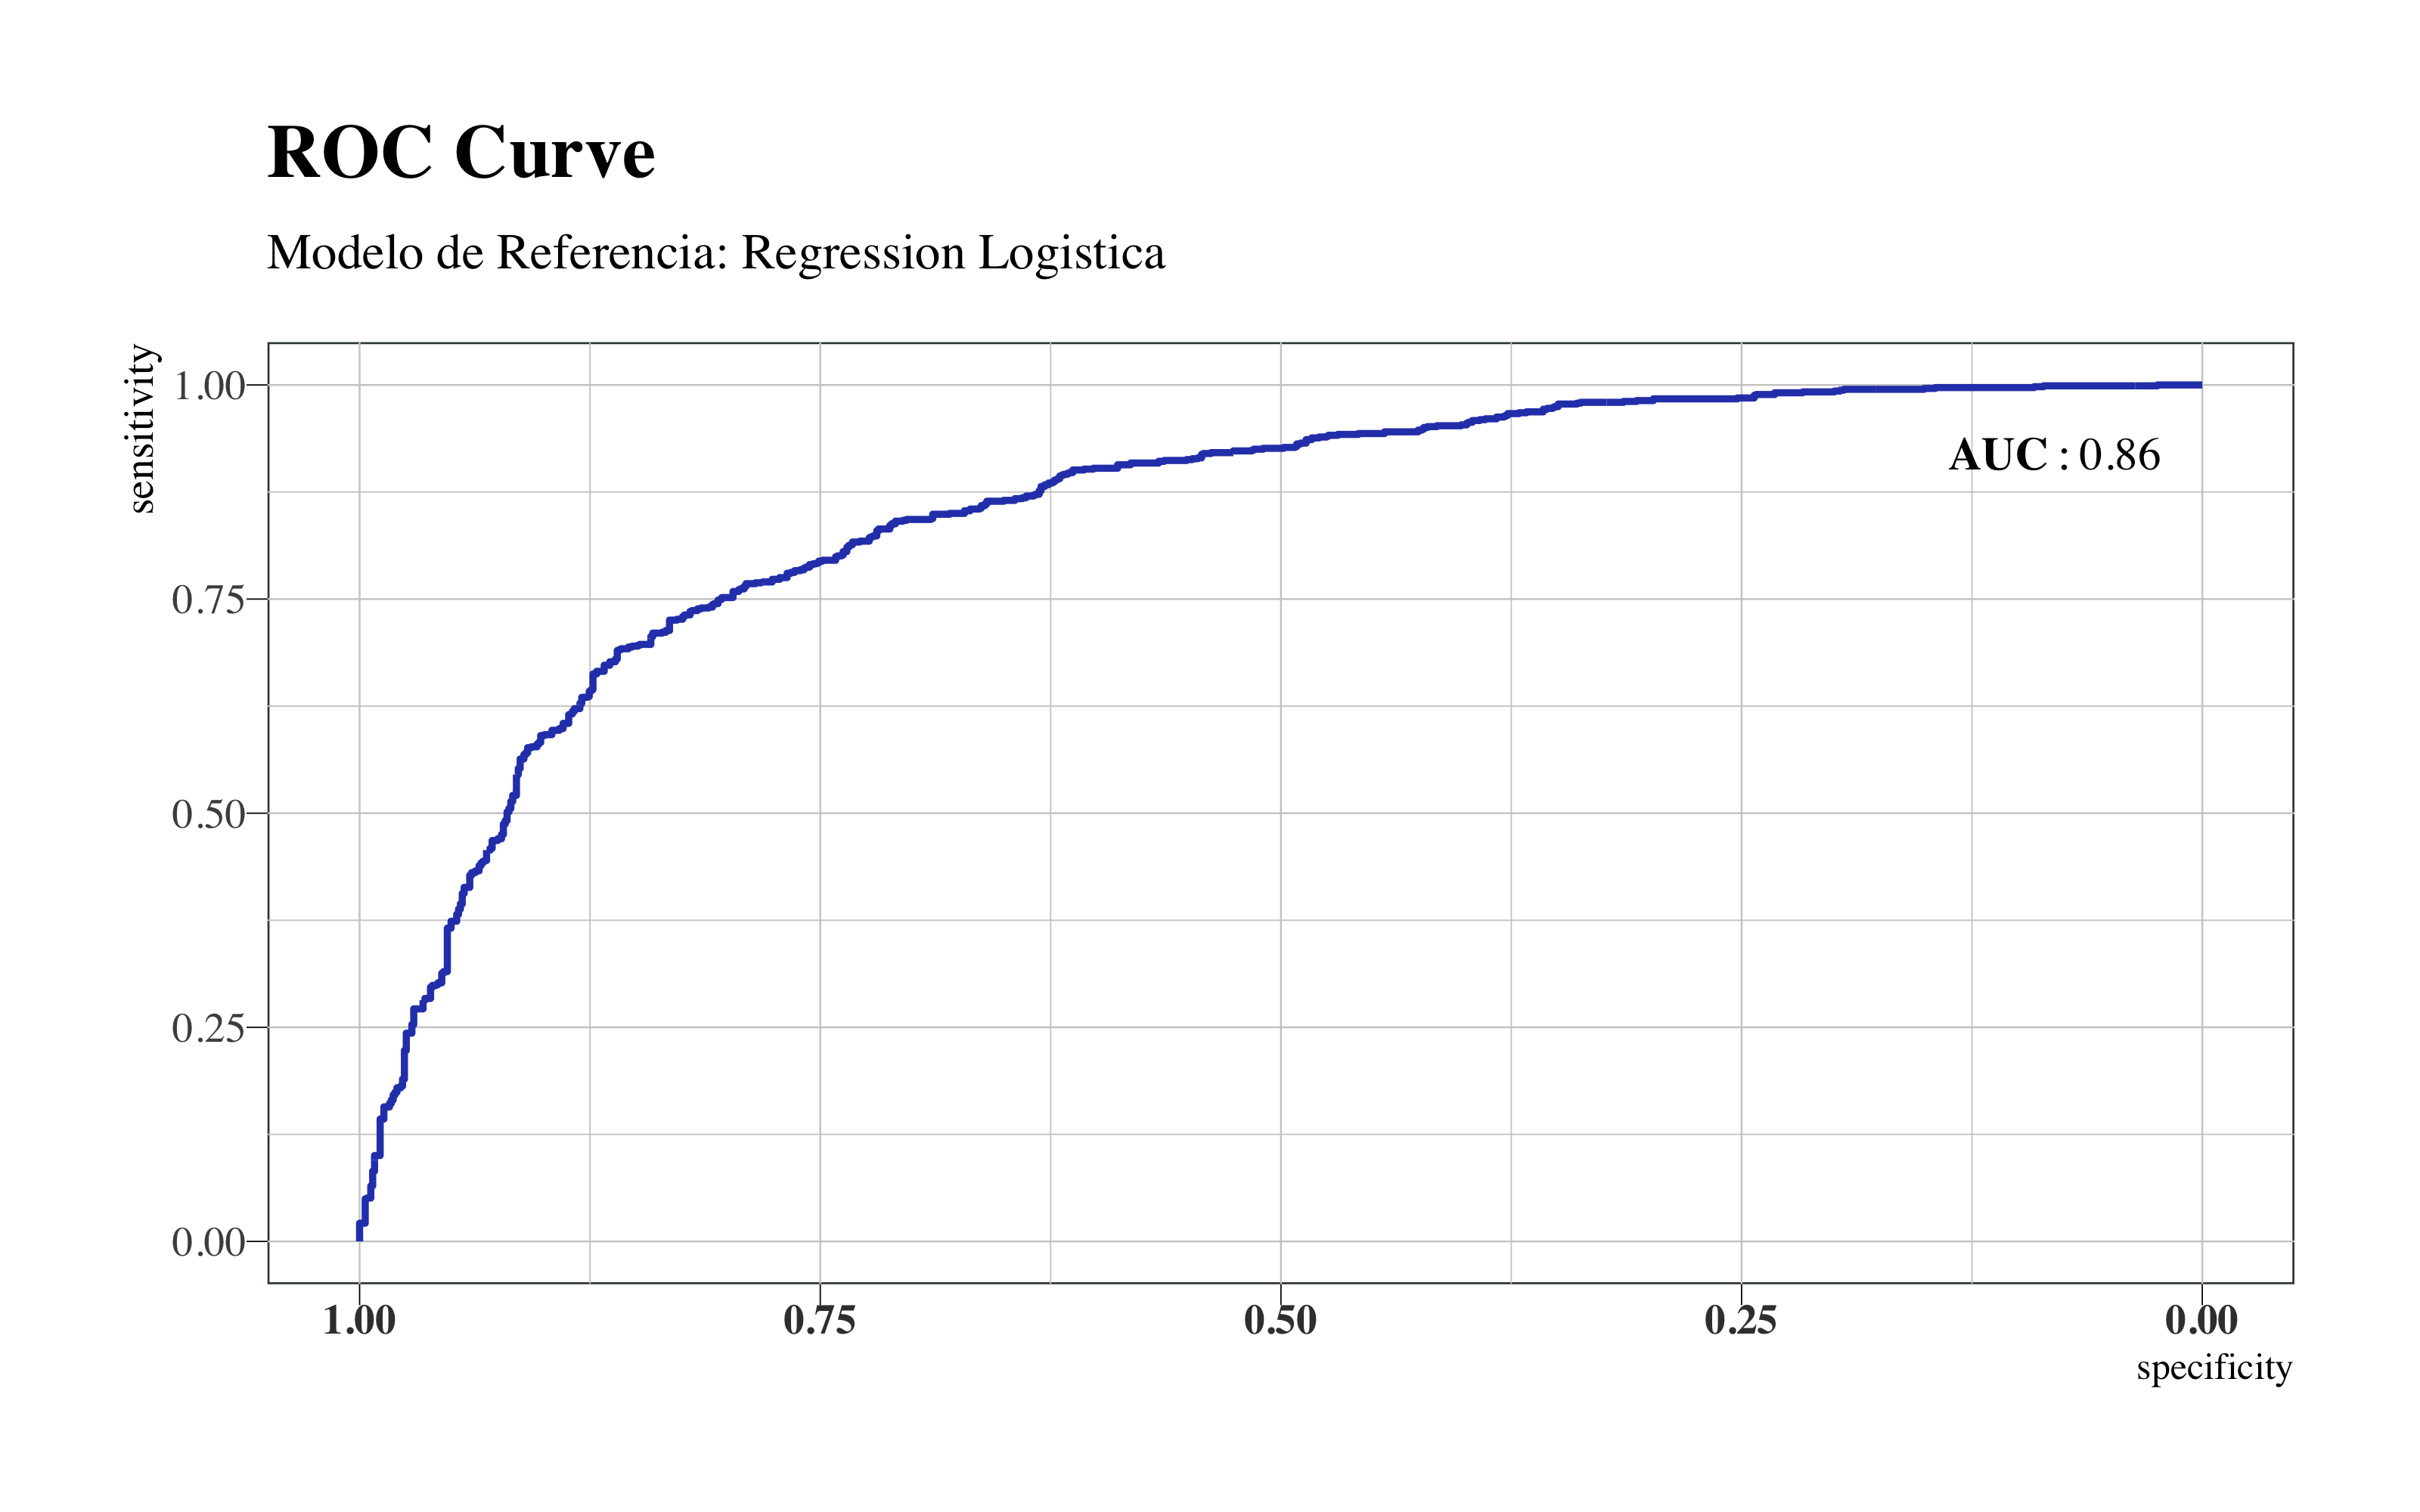
Regression Logistica
4.3 Decision Tree
4.3.1 Tuneo del Modelo
Un árbol demasiado complejo es inestable, mientras. Un árbol demasiado sencillo puede tener poca potencia predictiva (alto sesgo) o bajo valor explicativo. Así que haré un tuneo de los datos teniendo en consideración esto. En este proceso, me dí cuenta que los mejores modelos de árboles, en termine de accuracy, se encuentran tuneando solo el parámetro minbucket, que corresponde a el número de observaciones mínimas en cada nodo final. La librería caret no permite de hacer el tuneo, así que tuve que crear un bucle que me devuelva los distintos valores para cada valor de minbucket.
minbucket_ <- c()
Accuracy <- c()
Kappa <- c()
Auc <- c()

for (minbucket in seq(from = 5, to = 205, by = 10)) {
    arbolcaret <- train(factor(attrition) ~ age + daily_rate + distance_from_home +
        environment_satisfaction + hourly_rate + job_involvement + job_satisfaction +
        monthly_income + num_companies_worked + percent_salary_hike + performance_rating +
        relationship_satisfaction + stock_option_level + total_working_years + work_life_balance +
        years_at_company + years_since_last_promotion + business_travel_travel_rarely +
        business_travel_travel_frequently + business_travel_non_travel + department_sales +
        department_research_development + department_human_resources + education_2 +
        education_1 + education_4 + education_3 + education_5 + education_field_life_sciences +
        education_field_other + education_field_medical + education_field_marketing +
        education_field_technical_degree + education_field_human_resources + gender_female +
        gender_male + job_role_sales_executive + job_role_research_scientist + job_role_laboratory_technician +
        job_role_manufacturing_director + job_role_healthcare_representative + job_role_manager +
        job_role_sales_representative + job_role_research_director + job_role_human_resources +
        marital_status_single + marital_status_married + marital_status_divorced +
        over_time_yes + over_time_no, data = upTrain, method = "rpart", trControl = control,
        tuneGrid = expand.grid(cp = c(0)), control = rpart.control(minbucket = minbucket))

    confusionMatrix <- confusionMatrix(arbolcaret$pred$pred, arbolcaret$pred$obs)

    roc <- roc(response = arbolcaret$pred$obs, predictor = arbolcaret$pred$Yes)

    Acc_i <- confusionMatrix$overall[1]
    Accuracy <- append(Accuracy, Acc_i)

    K_i <- confusionMatrix$overall[2]
    Kappa <- append(Kappa, K_i)

    Auc_i <- roc$auc
    Auc <- append(Auc, Auc_i)

    minbucket_ <- append(minbucket_, minbucket)

    # \tsvMisc::progress(minbucket)
    dput("---------------")
    dput(paste0("With minbucket= ", minbucket))
    dput(paste0("Accuracy: ", round(confusionMatrix$overall[1], 3)))
    print(roc$auc)
}
arbol_results = cbind(data.frame(Accuracy, Kappa, Auc), minbucket = as.factor(c(seq(from = 5,
    to = 205, by = 10))))

# Clear cache ----
rm(Acc_i, K_i, Auc_i, minbucket, roc)
rm(Accuracy, Auc, Kappa, minbucket_)
•••>CLick to see console results
r > "---------------"\n
r > "With minbucket= 5"\n
r > "Accuracy: 0.841"\n
r > Area under the curve: 0.905 \n
r > "---------------"\n
r > "With minbucket= 15"\n
r > "Accuracy: 0.784"\n
r > Area under the curve: 0.842\n
r > "---------------"\n
r > "With minbucket= 25"\n
r > "Accuracy: 0.749"\n
r > Area under the curve: 0.813\n
r > "---------------"\n
r > "With minbucket= 35"\n
r > "Accuracy: 0.73"\n
r > Area under the curve: 0.792\n
r > "---------------"\n
r > "With minbucket= 45"
r > "Accuracy: 0.746"
r > Area under the curve: 0.806
r > "---------------"
r > "With minbucket= 55"
r > "Accuracy: 0.744"
r > Area under the curve: 0.789
r > "---------------"
r > "With minbucket= 65"
r > "Accuracy: 0.727"
r > Area under the curve: 0.788
r > "---------------"
r > "With minbucket= 75"
r > "Accuracy: 0.727"
r > Area under the curve: 0.774
r > "---------------"
r > "With minbucket= 85"
r > "Accuracy: 0.718"
r > Area under the curve: 0.75
r > "---------------"
r > "With minbucket= 95"
r > "Accuracy: 0.714"
r > Area under the curve: 0.753
r > "---------------"
r > "With minbucket= 105"
r > "Accuracy: 0.677"
r > Area under the curve: 0.71
r > "---------------"
r > "With minbucket= 115"
r > "Accuracy: 0.68"
r > Area under the curve: 0.715
r > "---------------"
r > "With minbucket= 125"
r > "Accuracy: 0.673"
r > Area under the curve: 0.701
r > "---------------"
r > "With minbucket= 135"
r > "Accuracy: 0.678"
r > Area under the curve: 0.695
r > "---------------"
r > "With minbucket= 145"
r > "Accuracy: 0.662"
r > Area under the curve: 0.688
r > "---------------"
r > "With minbucket= 155"
r > "Accuracy: 0.651"
r > Area under the curve: 0.684
r > "---------------"
r > "With minbucket= 165"
r > "Accuracy: 0.651"
r > Area under the curve: 0.664
r > "---------------"
r > "With minbucket= 175"
r > "Accuracy: 0.635"
r > Area under the curve: 0.662
r > "---------------"
r > "With minbucket= 185"
r > "Accuracy: 0.657"
r > Area under the curve: 0.674
r > "---------------"
r > "With minbucket= 195"
r > "Accuracy: 0.632"
r > Area under the curve: 0.662
r > "---------------"
r > "With minbucket= 205"
r > "Accuracy: 0.651"
r > Area under the curve: 0.675
# Plot ----
library(apexcharter)
apexchart(width = 800, ax_opts = list(chart = list(type = "line"), stroke = list(curve = "smooth"),
grid = list(borderColor = "#e7e7e7", row = list(colors = c("#f3f3f3", "transparent"),
opacity = 0.5)), markers = list(style = "inverted", size = 4), series = list(list(name = "Accuracy",
data = arbol_results$Accuracy), list(name = "Kappa", data = arbol_results$Kappa),
list(name = "AUC", data = arbol_results$Auc)), title = list(text = "Training Results",
align = "center"), xaxis = list(categories = arbol_results$minbucket))) %>%
ax_yaxis(labels = list(formatter = format_num(".0%"))) %>%
ax_stroke(curve = "stepline", width = 2) %>%
ax_colors("#4B69CE", "#B0BDE9", "#4A80CF")Tuneo del arbol
A menor minbucket, obtendré árboles más complejos. Como podemos comprobar de este plot, para estos datos el modelo parece que se establece alrededor del valor minbucket=100. Por valores inferiores a 65 se obtendría un modelo sobreajustado. Entonces como que los resultados son parecidos, me quedo con el valor de 105 para obtener un modelo más estable y que no sea propenso a alto sesgo.
4.3.2 Plot del Mejor Árbol
# poner maxsurrogate=0 para que solo nos presente la importancia de las
# variables que efectivamente participen en el modelo
rpart(factor(attrition) ~ ., data = upTrain, minbucket = 105, method = "class", maxsurrogate = 0,
parms = list(split = "gini")) -> arbollibrary(rpart.plot)
rpart.plot(arbol, type = 4, extra = 105, nn = F, tweak = 1.7, gap = 1, space = 2,
box.palette = "Blues")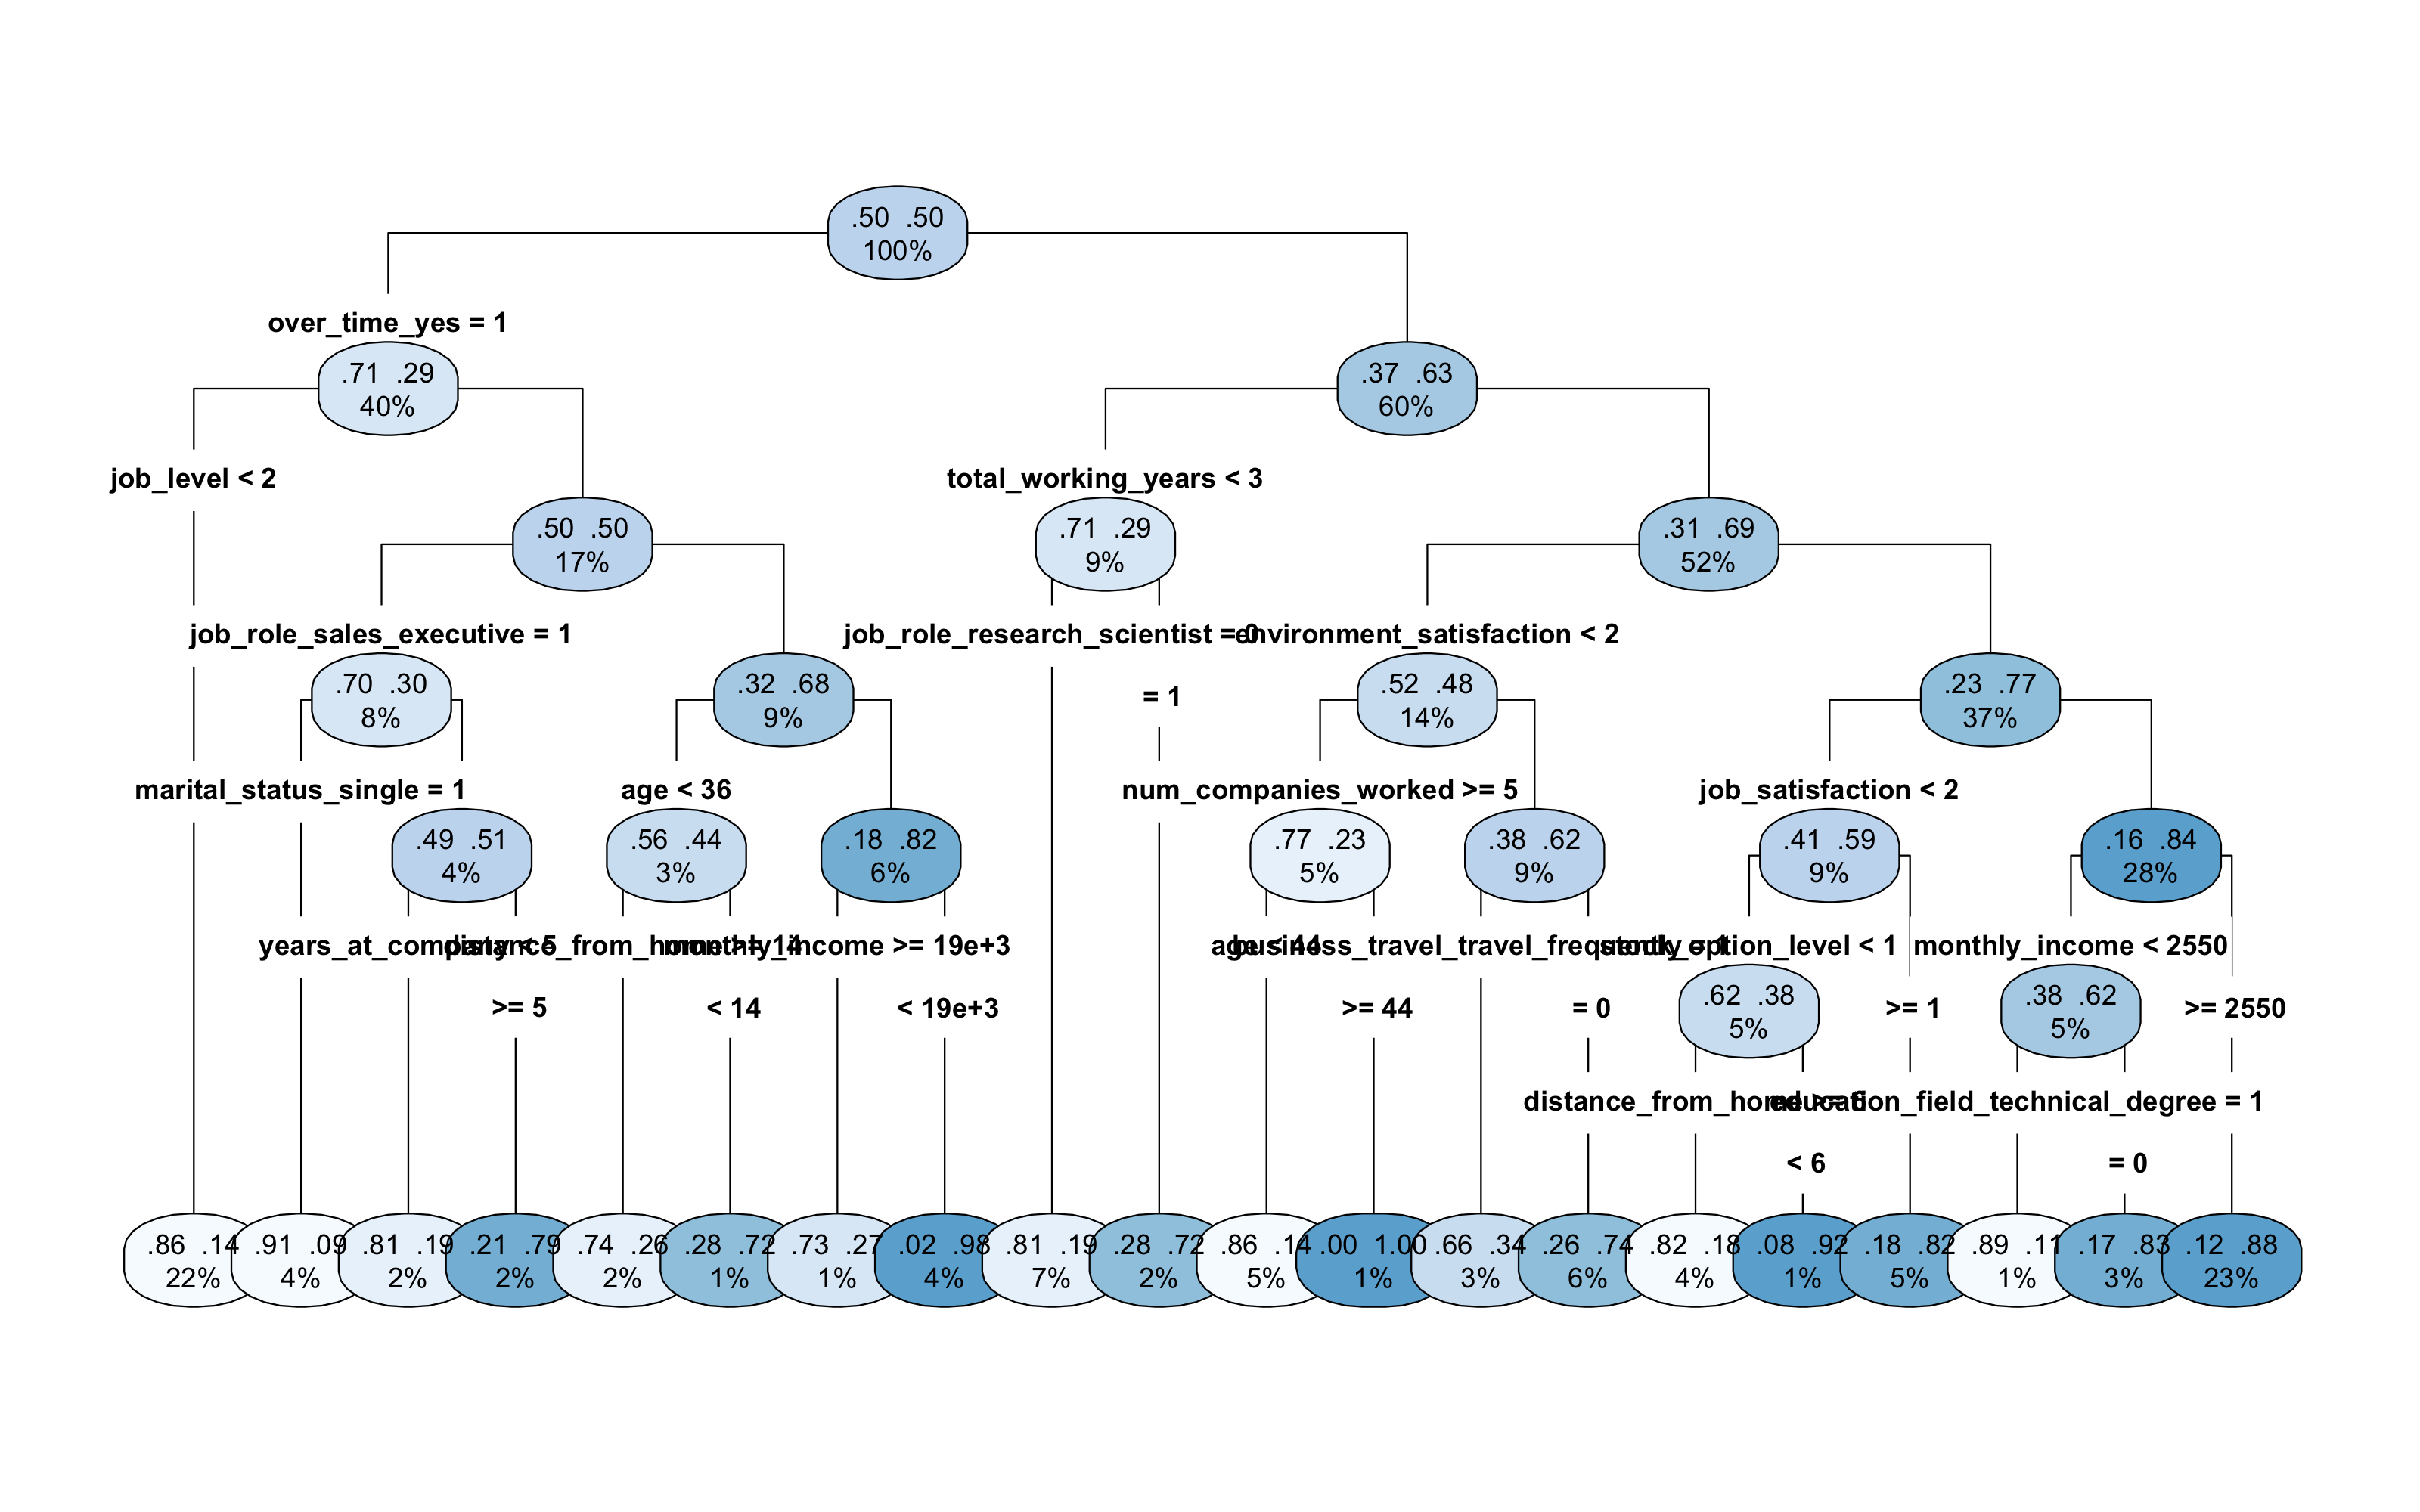 Como podemos observar de este plot, según el árbol de decisión la variable mas influyente es OverTime_yes, es decir los empleados que trabajan muchas veces más de las horas previstas, tienden a dejar su puesto de trabajo. También, influyen mucho si el empleado trabaja desde poco tiempo a la empresa. Este se puede notar por la importancia de las variables Total Working Years y Job Level que a niveles menores, es decir el empleado trabaja desde poco tiempo a la empresa y tiene puesto de trabajo de los primeros niveles, suele marcharse.
4.3.3 Matriz de Confusión y Importancia de Variables
arbolcaret <- train(factor(attrition) ~ ., data = upTrain, method = "rpart", trControl = control,
    tuneGrid = expand.grid(cp = c(0)), control = rpart.control(minbucket = 105, maxsurrogate = 0))

source("files/ConfusionMatrix.R")
draw_confusion_matrix(confusionMatrix(arbolcaret$pred$pred, arbolcaret$pred$obs),
    "#D6DBF5", "#2E45B8")

ggplot(vip::vi(arbol) %>%
    filter(Importance > 0) %>%
    mutate(Variable = stringr::str_to_title(Variable)) %>%
    mutate(Variable = str_replace_all(Variable, "_", " ")), aes(x = reorder(Variable,
    Importance), y = Importance)) + ggchicklet::geom_chicklet(aes(fill = Importance),
    radius = grid::unit(10, "pt"), width = 1, show.legend = F) + labs(x = NULL, title = "Variable Importance Plot Arbol") +
    scale_y_continuous(position = "right") + scale_fill_gradient(low = "#D6DBF5",
    high = "#2E45B8") + coord_flip() + hrbrthemes::theme_ipsum(base_family = "Times",
    grid = "X") + theme(plot.title = element_text(hjust = 0, vjust = -0.5), plot.margin = unit(c(0,
    1, 0.5, 0.5), "cm"))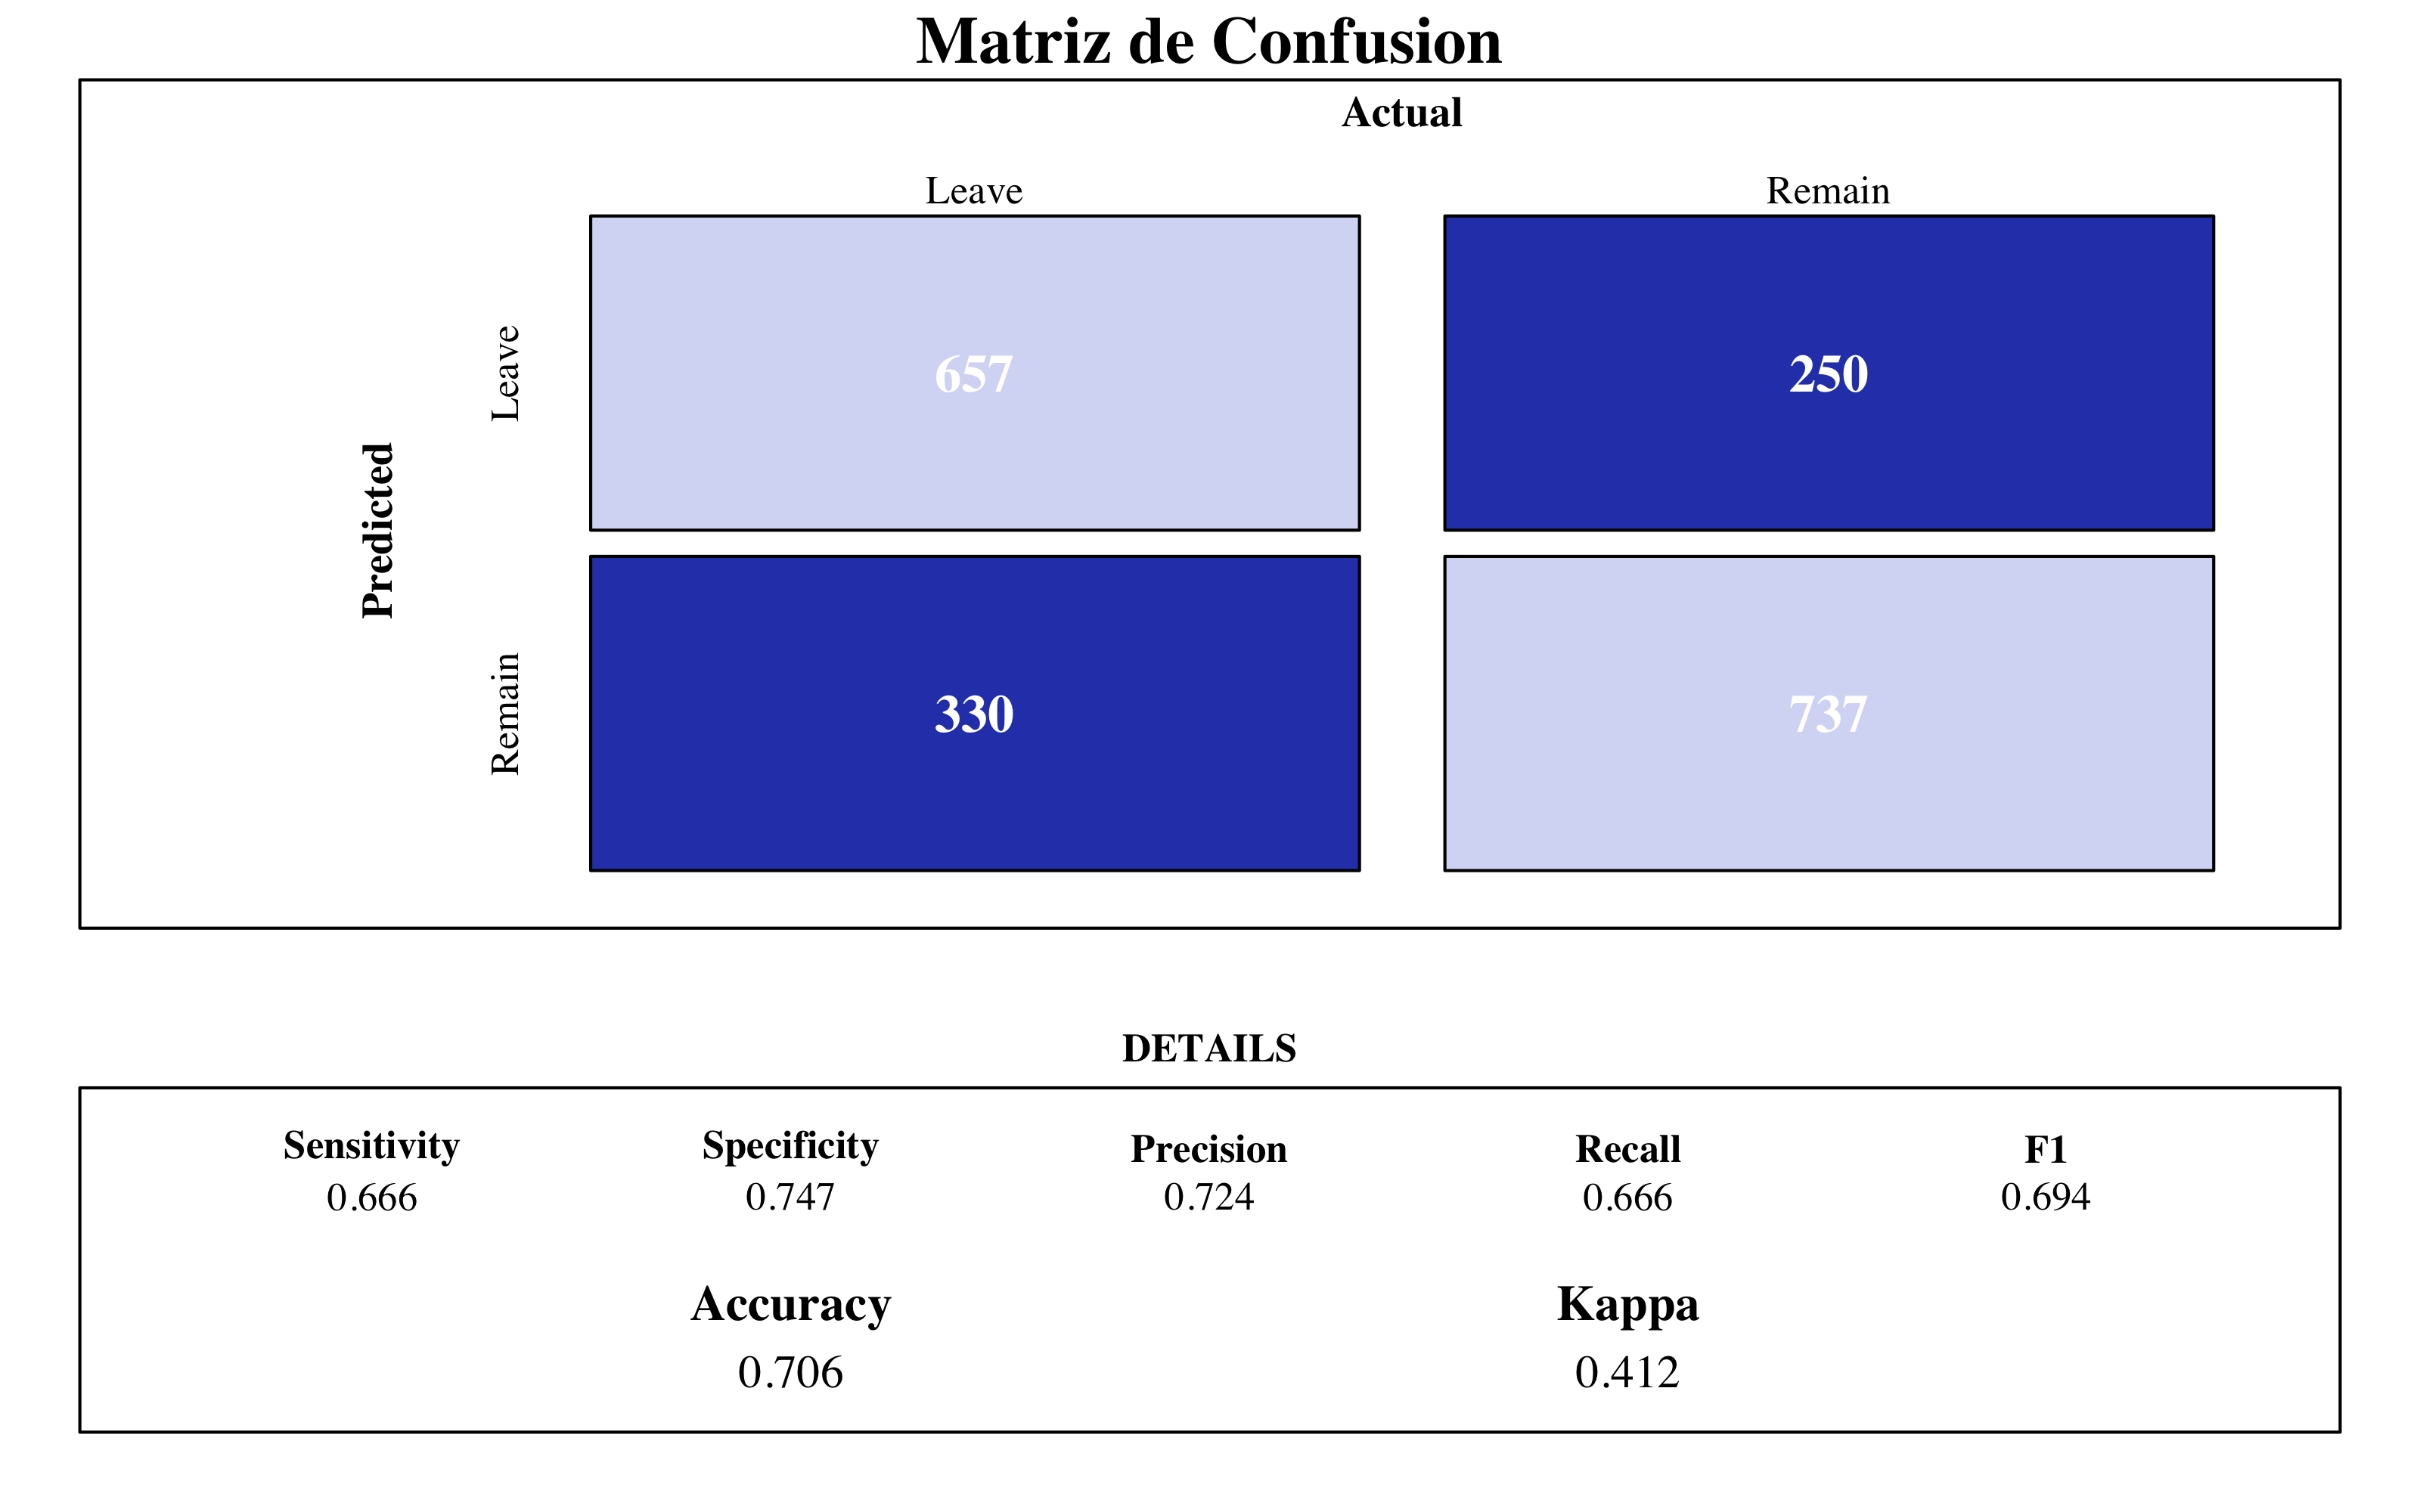
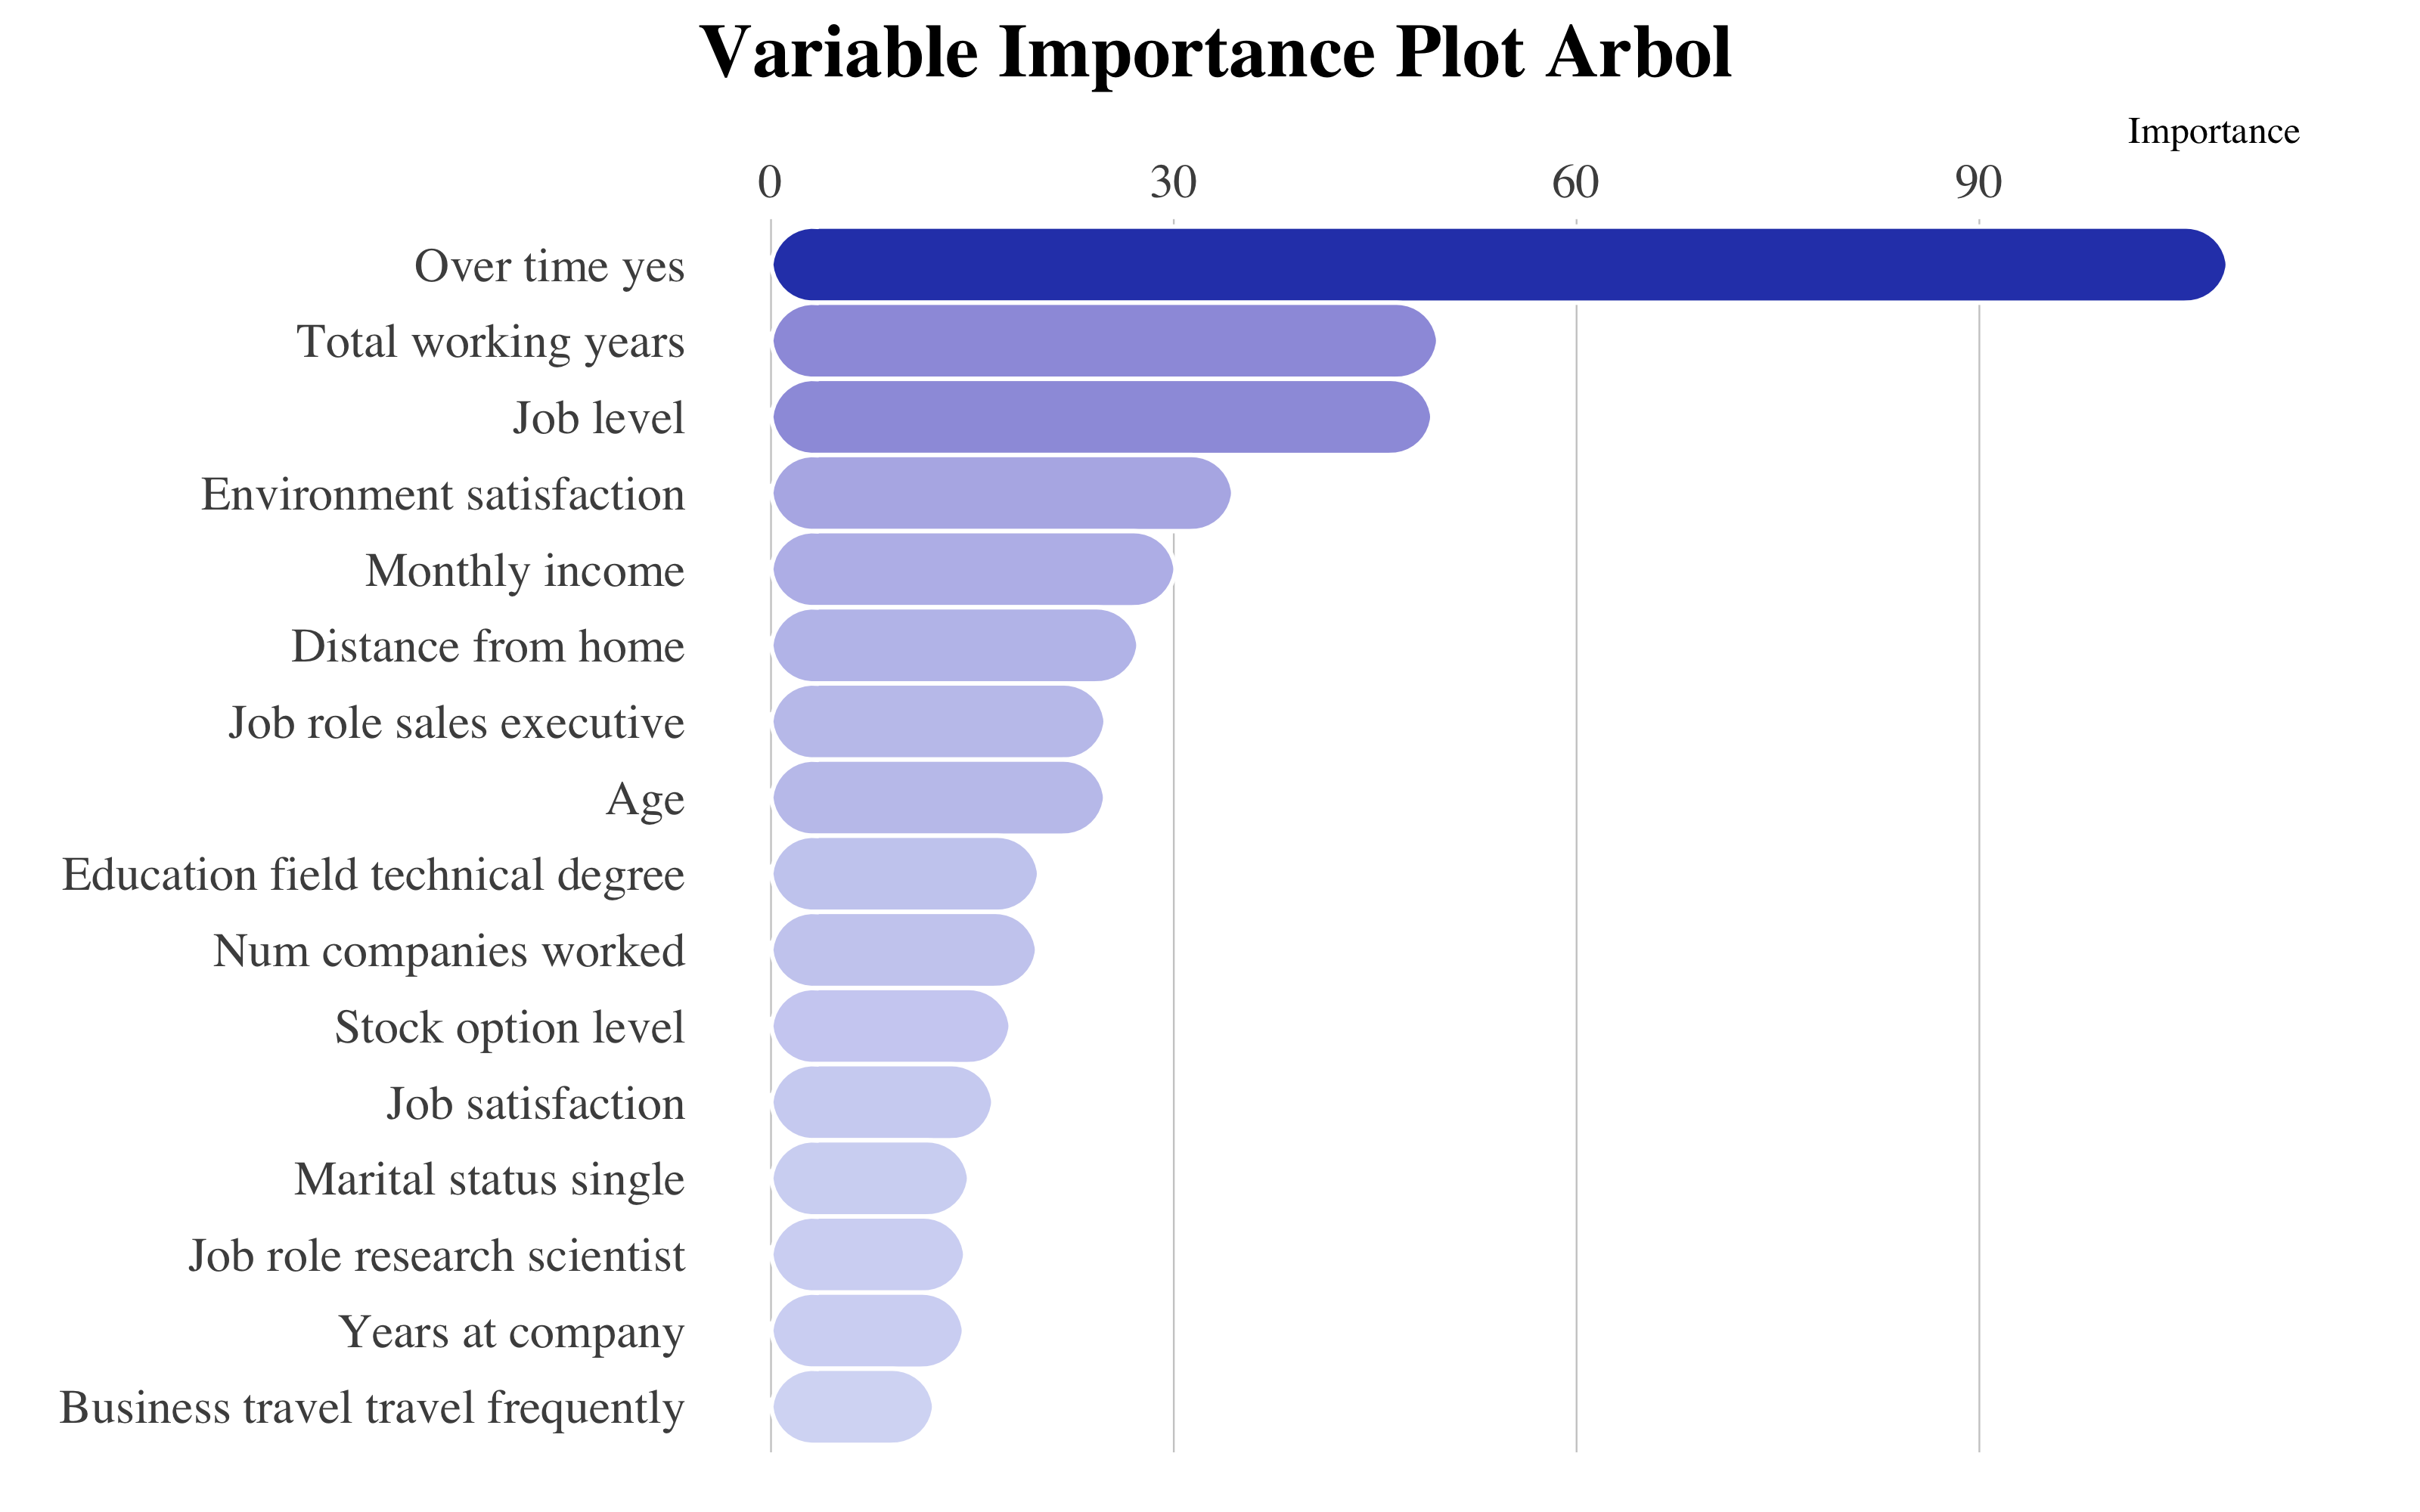
Final Model
Según este árbol de decision, las variables más importantes son el OverTime_Yes, que toma mayor importancia comparada con las demás, el total de años trabajando y enseguida encontramos la satisfacción al entorno y el nivel del trabajo y el salario mensual.
El árbol planteado no mejora el modelo de referencia de regresión logística (accuracy = 0.77). Este porque un árbol solo es incline a alta varianza. Por esta razón, implementaré algoritmos de ensemble methods.
4.4 Bagging Tree
El Bootstrap aggregating (bagging) es un método que consegue reducir la varianza y el sobreajuste. El algoritmo funciona de esta manera:
Dado un conjunto de entrenamiento inicial de tamaño n, el bagging genera m nuevos conjuntos de entrenamiento, cada uno de tamaño n’, haciendo un remuestreo desde el conjunto inicial, uniformemente y con reemplazo (bootstrap sample). El muestreo con reemplazo asegura que cada bootstrap sea independiente de sus pares. Luego, los m modelos se ajustan utilizando las m muestras bootstrap y se combinan promediando el output.
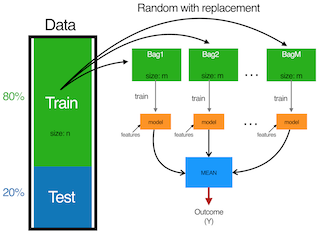
Bagging process
Con estos datos, me espero que el bagging va a ser un buen modelo en cuanto mis variables no tienen separaciones lineales y hay muchas variables categorícas.
4.4.1 Tuneo del Modelo
library(doParallel)
library(tictoc)
registerDoParallel(makeCluster(3) -> cpu)

nodesize_ <- c()
sampsize_ <- c()
Accuracy <- c()
Kappa <- c()
Auc <- c()

tic()
for (nodesize in c(20,40,60,80,100)) {
    for (sampsize in c(200,500,800,1200,1570)) {
bg <- train(data=upTrain,
                factor(attrition)~.,
                method="rf", trControl= control,
                #fijar mtry for bagging
                tuneGrid= expand.grid(mtry=c(51)),
                ntree = 5000,
                sampsize = sampsize,
                nodesize = nodesize,
                #muestras con reemplazamiento
                replace = TRUE,
                linout = FALSE)

confusionMatrix <- confusionMatrix(
    bg$pred$pred, bg$pred$obs)

roc <- roc(response = bg$pred$obs,
                     predictor = bg$pred$Yes)

Acc_i <- confusionMatrix$overall[1]
Accuracy <- append(Accuracy, Acc_i)

K_i <- confusionMatrix$overall[2]
Kappa <- append(Kappa, K_i)

Auc_i <- roc$auc
Auc <- append(Auc, Auc_i)

nodesize_ <- append(nodesize_, nodesize)
sampsize_ <- append(sampsize_, sampsize)

dput("---------------")
dput(paste0("With nodesize= ", nodesize))
dput(paste0("With sampsize= ", sampsize))
dput(paste0("Accuracy: ",
                        round(confusionMatrix$overall[1], 3)))
print(roc$auc)
    }
}
toc()
stopCluster(cpu)

# Aggregate Metrics ----
bagging_results = cbind(
    data.frame(Accuracy, Kappa, Auc, nodesize = nodesize_, sampsize=sampsize_))

#save(bagging_results, file="bagging_results.RData")

# Clear cache ----
rm(Acc_i, K_i, Auc_i, nodesize, roc, sampsize)
rm(Accuracy, Auc, Kappa, nodesize_, sampsize_)library(ggeconodist)
ggplot(bagging_results, aes(x = factor(nodesize), Auc)) + geom_econodist(tenth_col = "#879DDD",
median_col = "#1D2F65", ninetieth_col = "#3252B1") + scale_y_continuous(position = "right",
limits = range(0.7, 1)) + labs(x = "nodesize", title = "Tuning Bagging nodesize",
subtitle = "Resultados finales bucle, parametro nodesize y comparacion con AUC") +
theme_econodist(econ_text_col = "#3b454a", econ_plot_bg_col = "#E6EAF8", econ_grid_col = "#bbcad2",
econ_font = "Times", light_font = "Times", bold_font = "Times") + theme(plot.title = element_text(face = "bold")) ->
gg
grid.newpage()
left_align(gg, c("subtitle", "title", "caption")) %>%
add_econodist_legend(econodist_legend_grob(family = "Times", tenth_col = "#879DDD",
ninetieth_col = "#3252B1"), below = "subtitle") %>%
grid.draw()
ggplot(bagging_results, aes(x = factor(nodesize), Accuracy)) + geom_econodist(tenth_col = "#879DDD",
median_col = "#1D2F65", ninetieth_col = "#3252B1") + scale_y_continuous(position = "right",
limits = range(0.7, 1)) + labs(x = "nodesize", title = "Tuning Bagging nodesize",
subtitle = "Resultados finales bucle, parametro nodesize y comparacion con Accuracy") +
theme_econodist(econ_text_col = "#3b454a", econ_plot_bg_col = "#E6EAF8", econ_grid_col = "#bbcad2",
econ_font = "Times", light_font = "Times", bold_font = "Times") + theme(plot.title = element_text(face = "bold")) ->
gg
grid.newpage()
left_align(gg, c("subtitle", "title", "caption")) %>%
add_econodist_legend(econodist_legend_grob(family = "Times", tenth_col = "#879DDD",
ninetieth_col = "#3252B1"), below = "subtitle") %>%
grid.draw()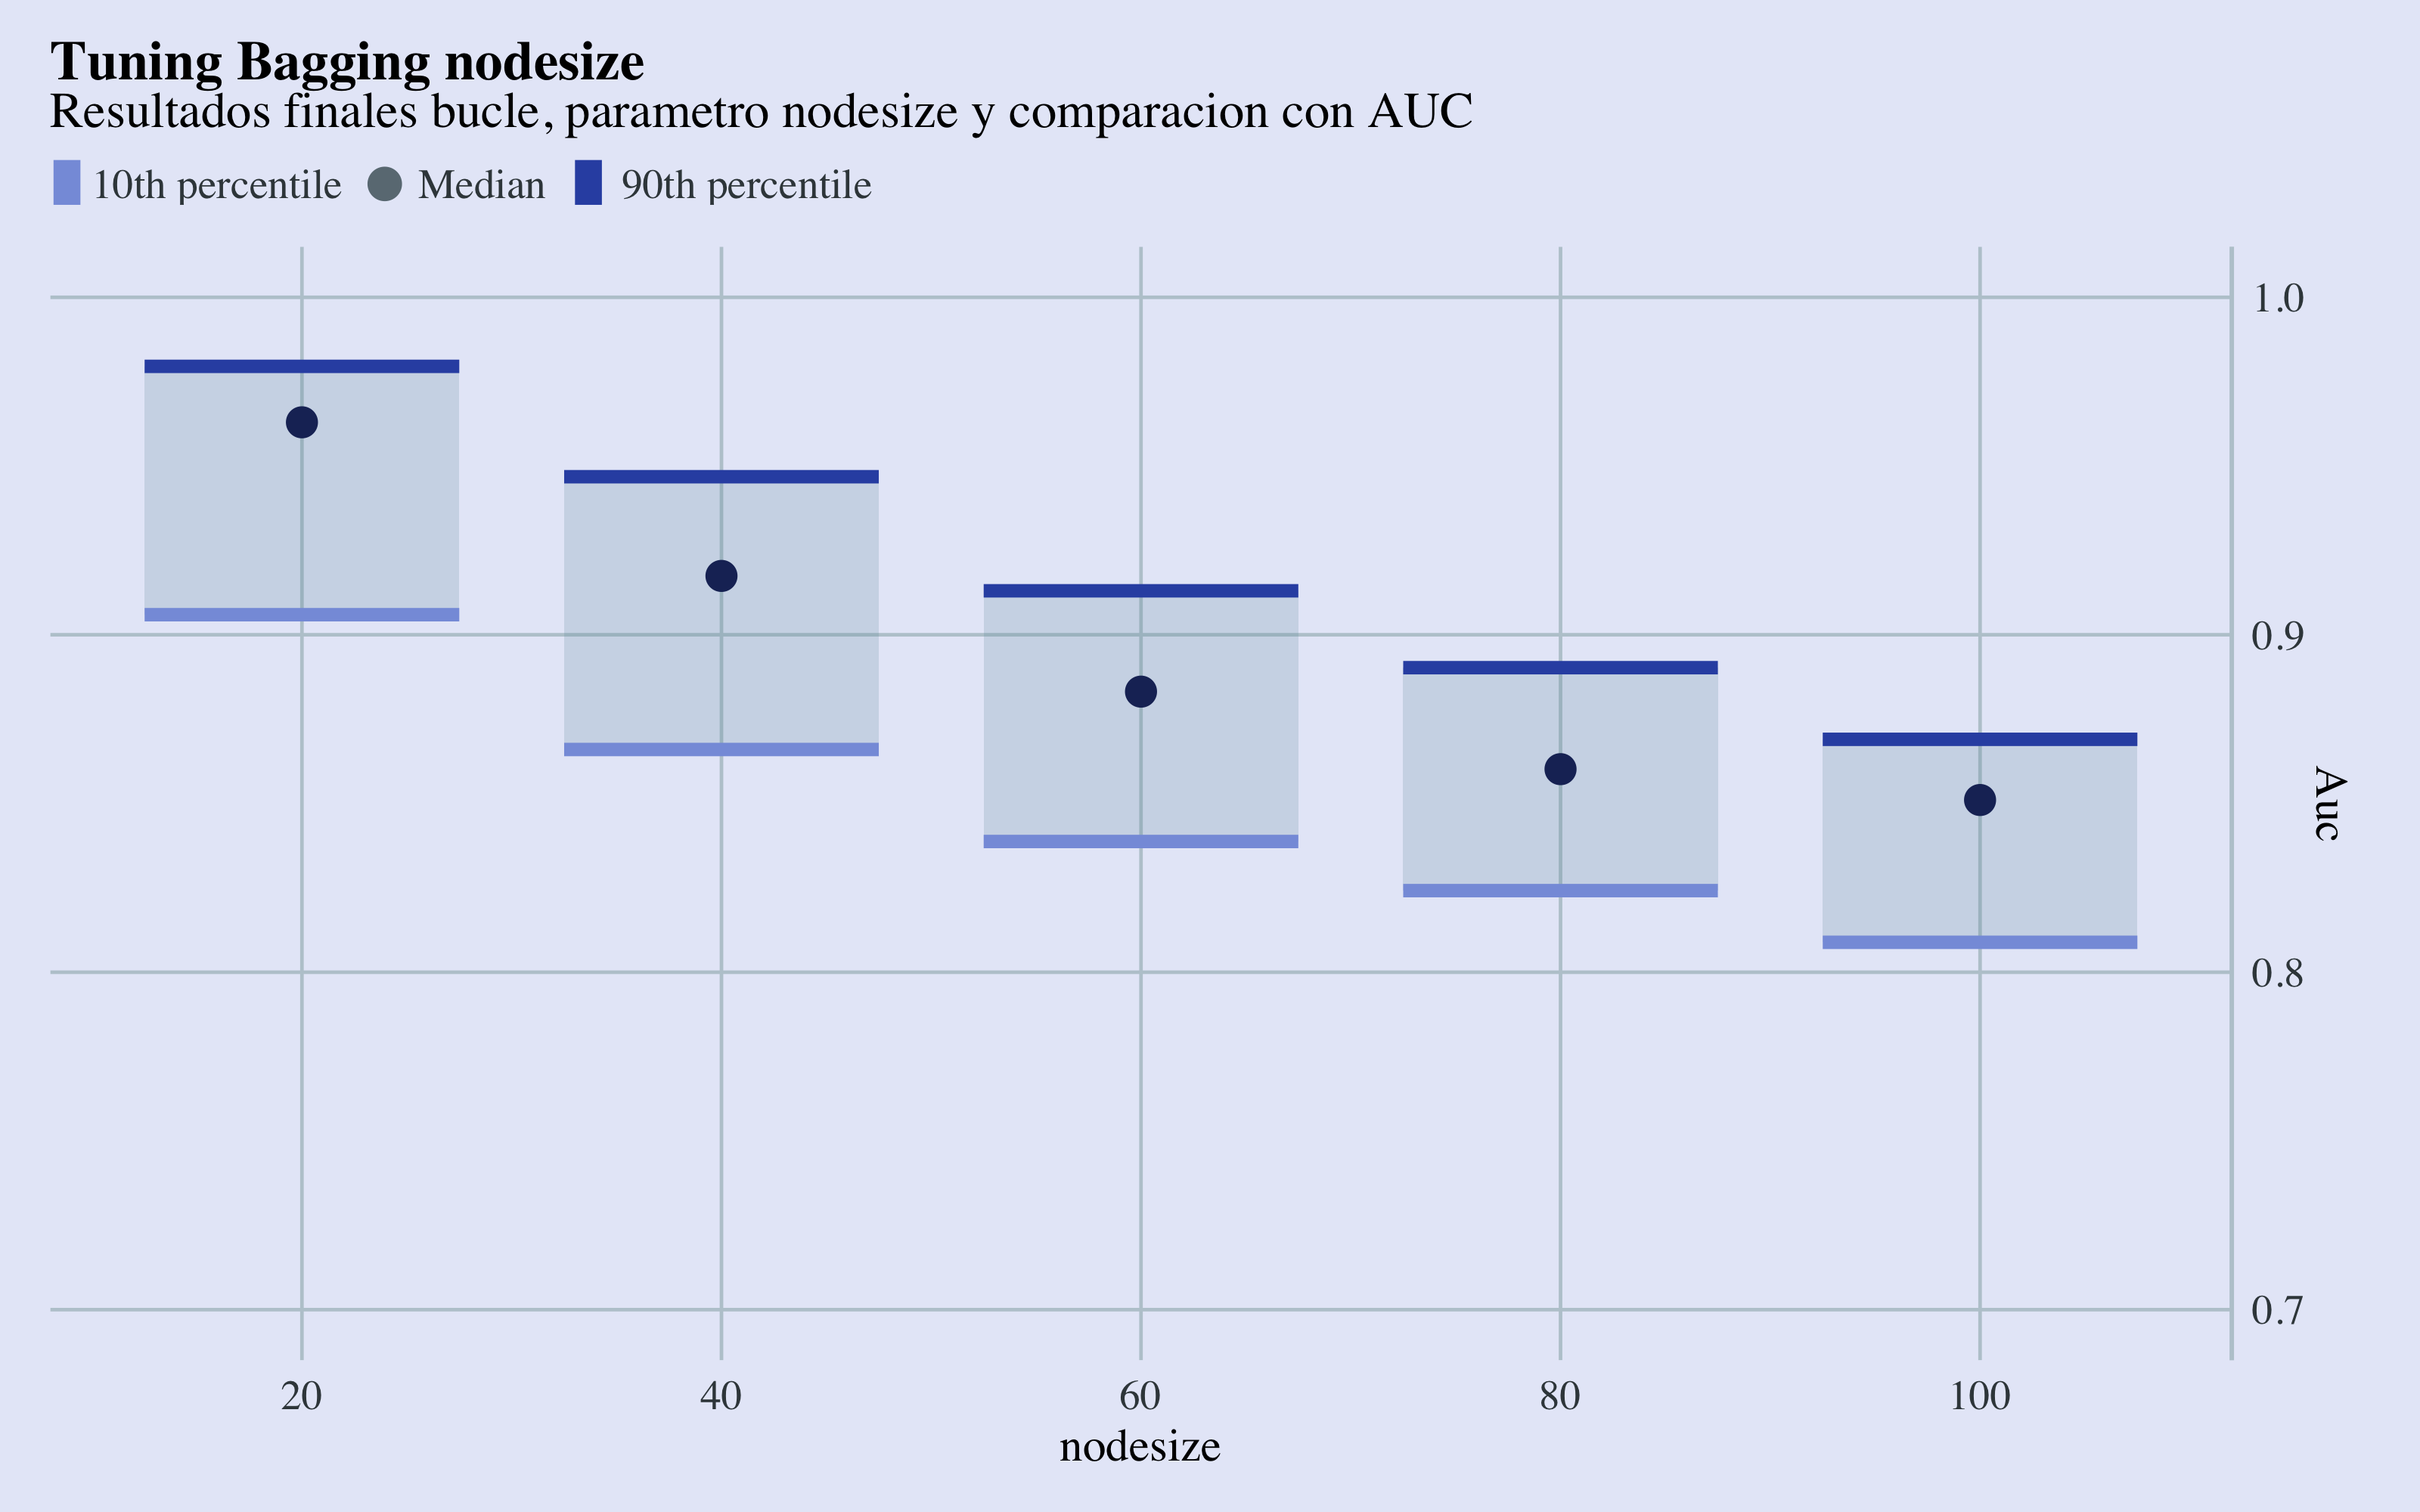
Tuning Nodesize Results
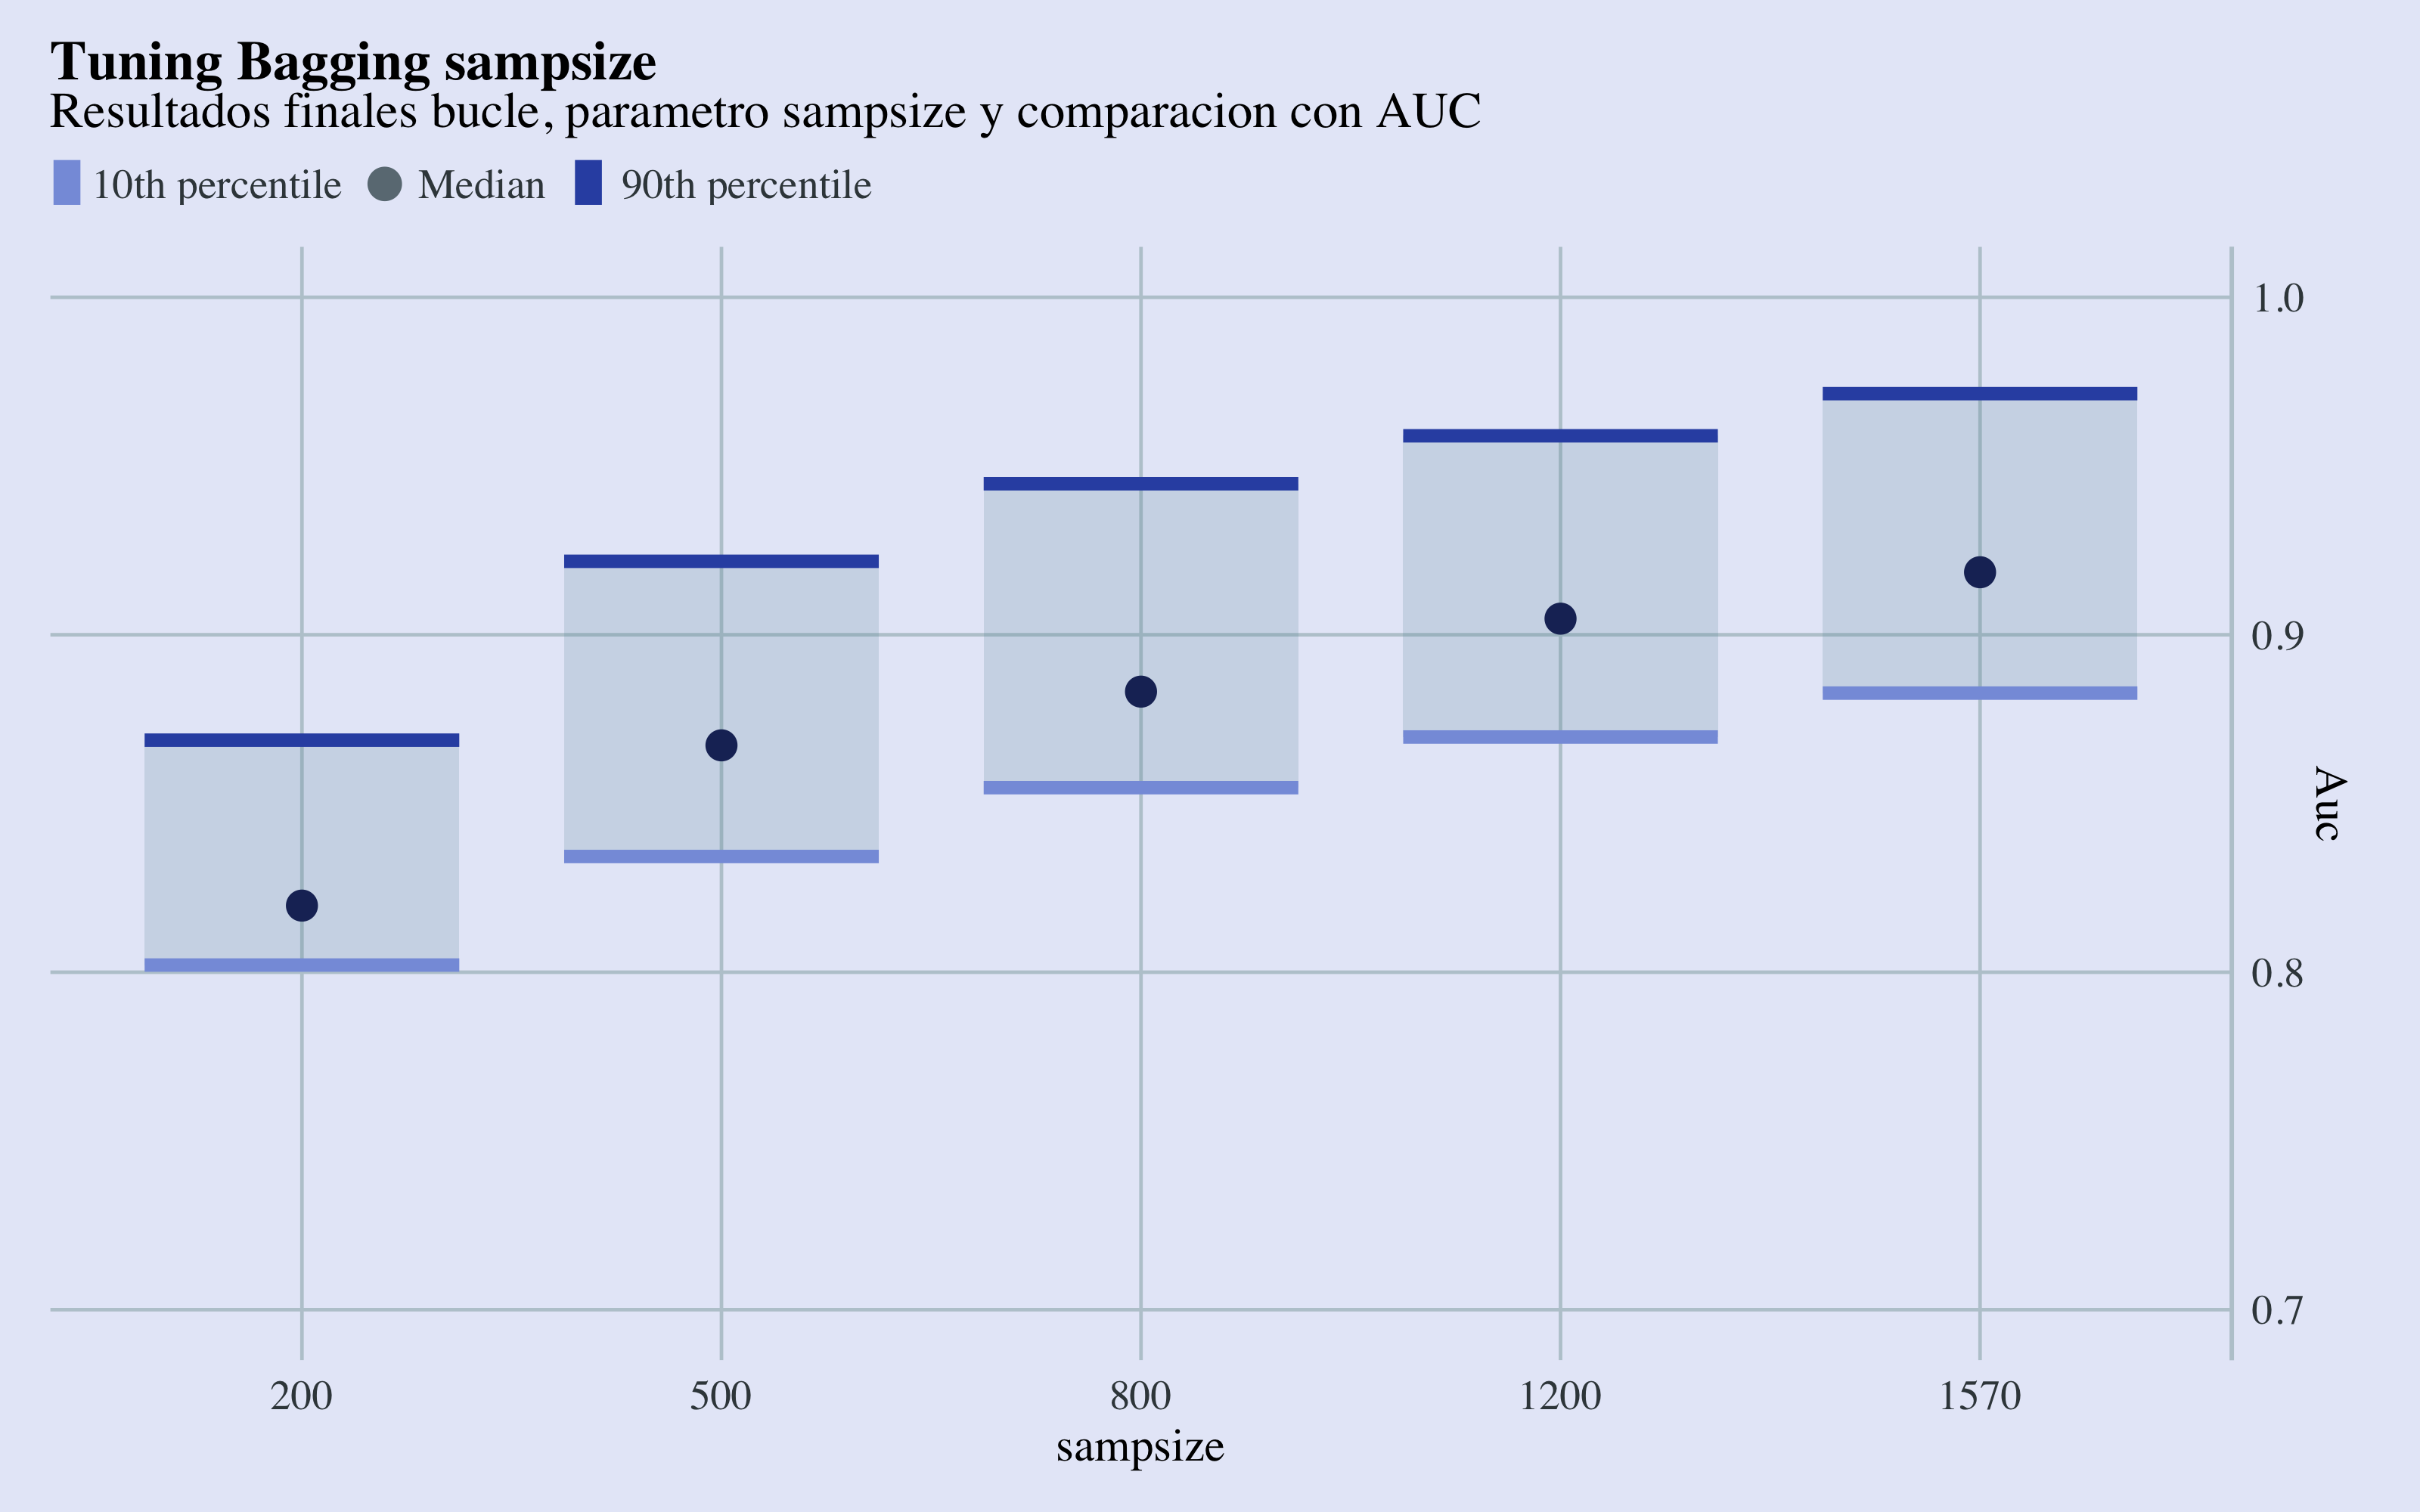
Haciendo validación cruzada, tengo que dejar un fold de tamaño (1974/5)=394, por lo tanto utilizaré (4/5)*1974=1579 observaciones training para construir el modelo, con lo cual fijare el sampsize máximo con 1578 observaciones.
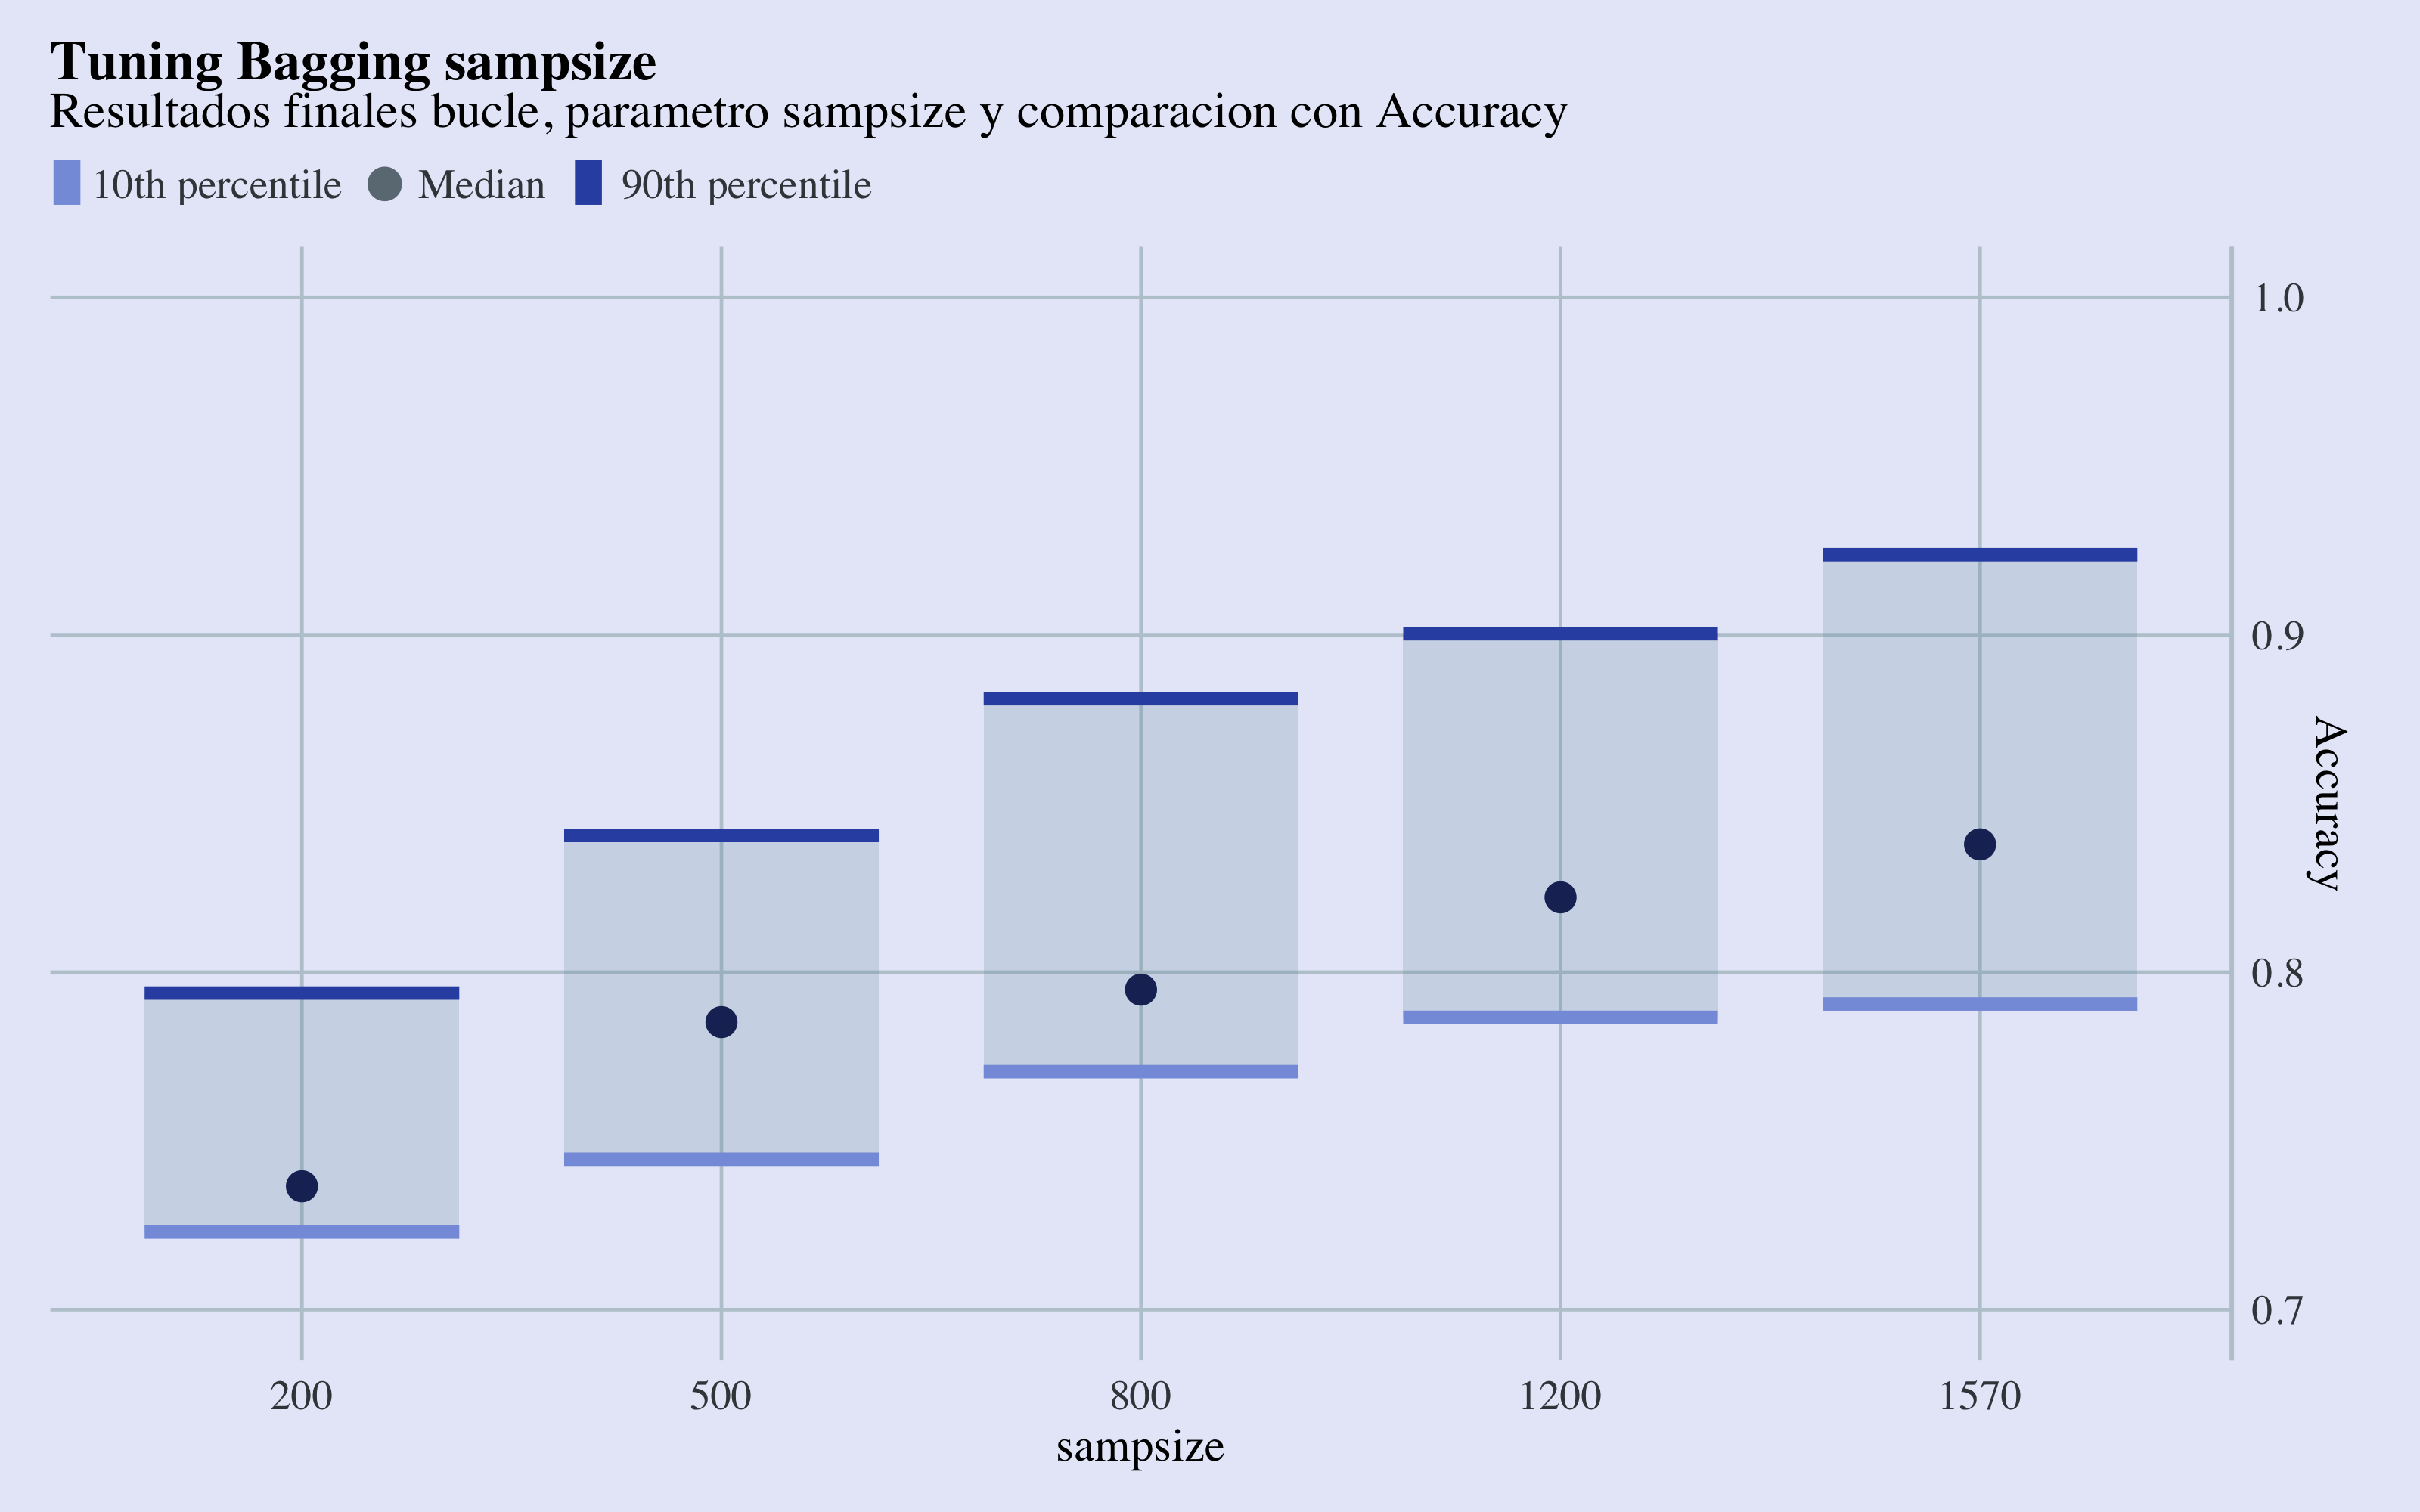
Tuning Sampsize Results
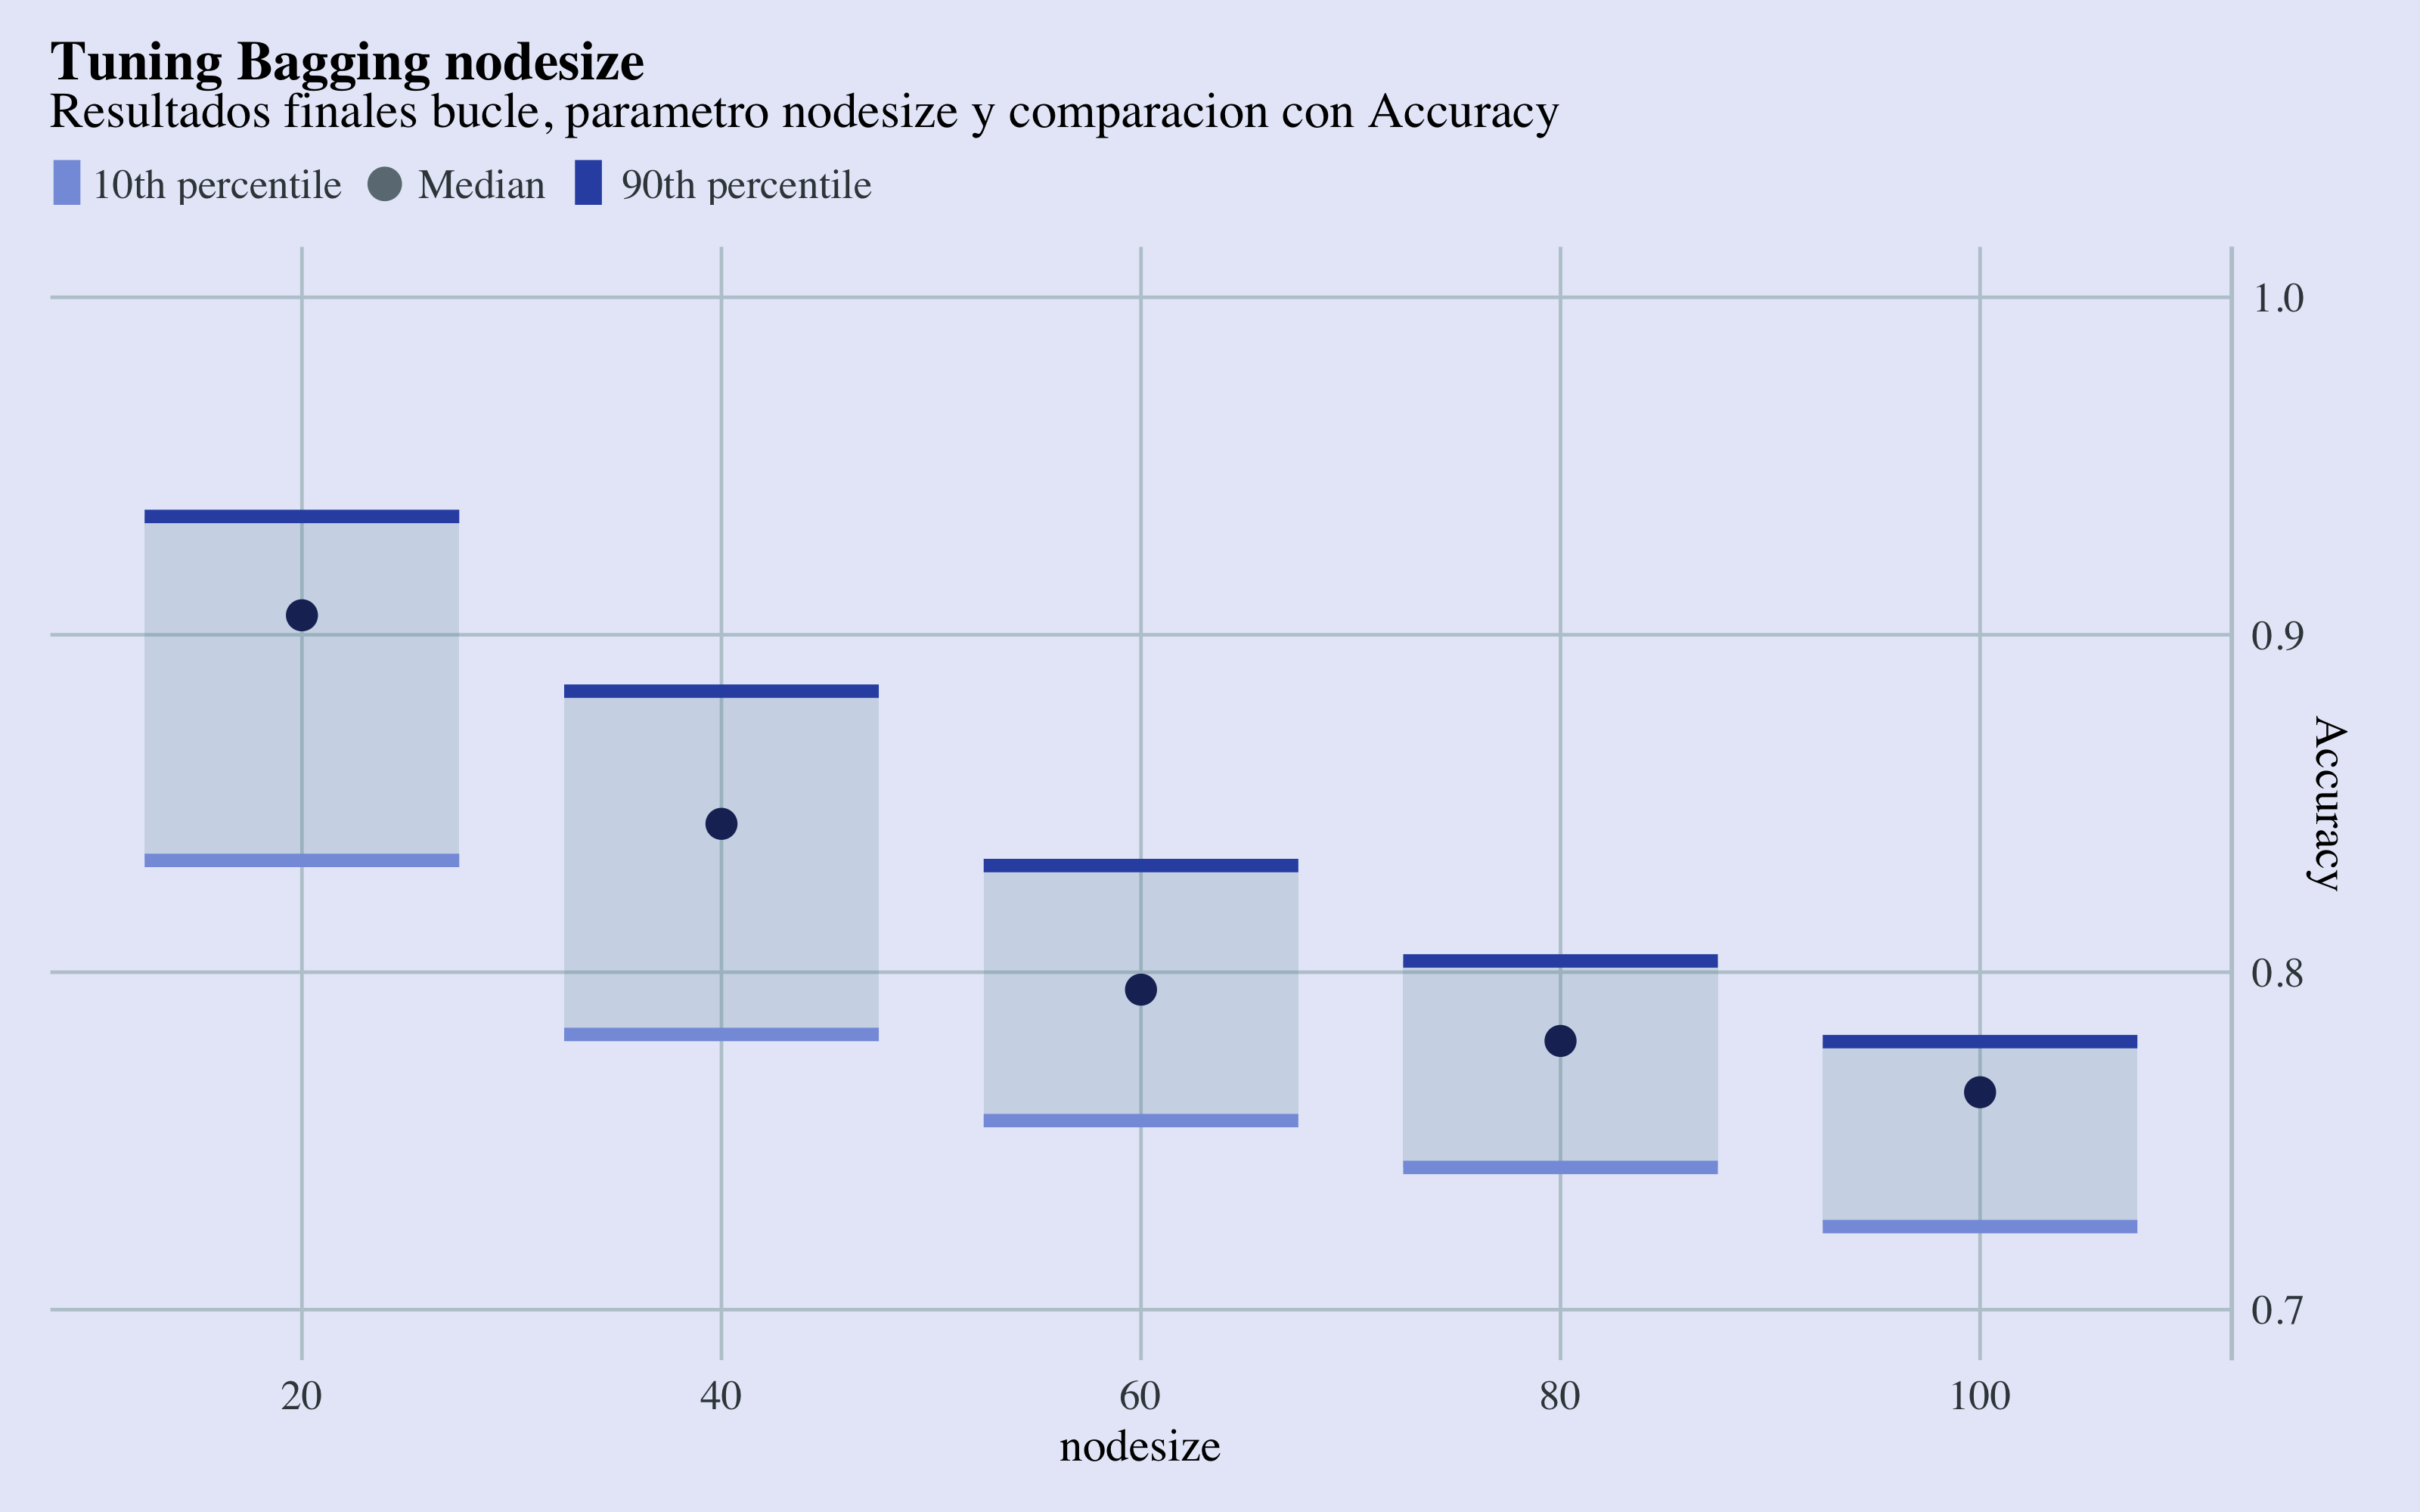
Con estos gráficos de cajas y bigotes, se puede observar que los parámetros que llevan a las mejores métricas, en termines de área abajo la curva ROC y accuracy son sampsize=1570 y el valor más bajo de nodesize, que por razones de establead no elijaré. Me quedaré con un nodesize de 40.
4.4.2 Modelo final
library(randomForest)
bg <- randomForest(data = upTrain, factor(attrition) ~ ., mtry = 51, ntree = 1000,
    sampsize = 1570, nodesize = 40, replace = TRUE, importance = TRUE)
4.4.2.1 Out-Of-Bag Error
El Out-Of-Bag (OOB) es el error cometido en las observaciones que no caen en la muestra en cada iteración-árbol, y por tanto pueden ser tomados como observaciones test y sirven para observar el error cometido sobre test a medida que avanzan las iteracciones.
as.tibble(cbind(OOB = bg$err.rate[, 1], ntree = seq(1:nrow(bg$err.rate)))) %>%
    ggplot(aes(x = ntree, y = OOB)) + geom_step(aes(col = OOB)) + scale_color_continuous(low = "#2E45B8",
    high = "#D6DBF5") + hrbrthemes::theme_ipsum(base_family = "Times", base_size = 10) +
    labs(title = "Out-Of-Bag Error", subtitle = "Bagging model") + theme(title = element_text(face = "bold"),
    legend.position = "none", panel.background = element_rect(color = "#3b454a"),
    axis.title.y = element_text(size = 10), axis.text.x = element_text(face = "bold",
        colour = "#3D3D3D", size = 10))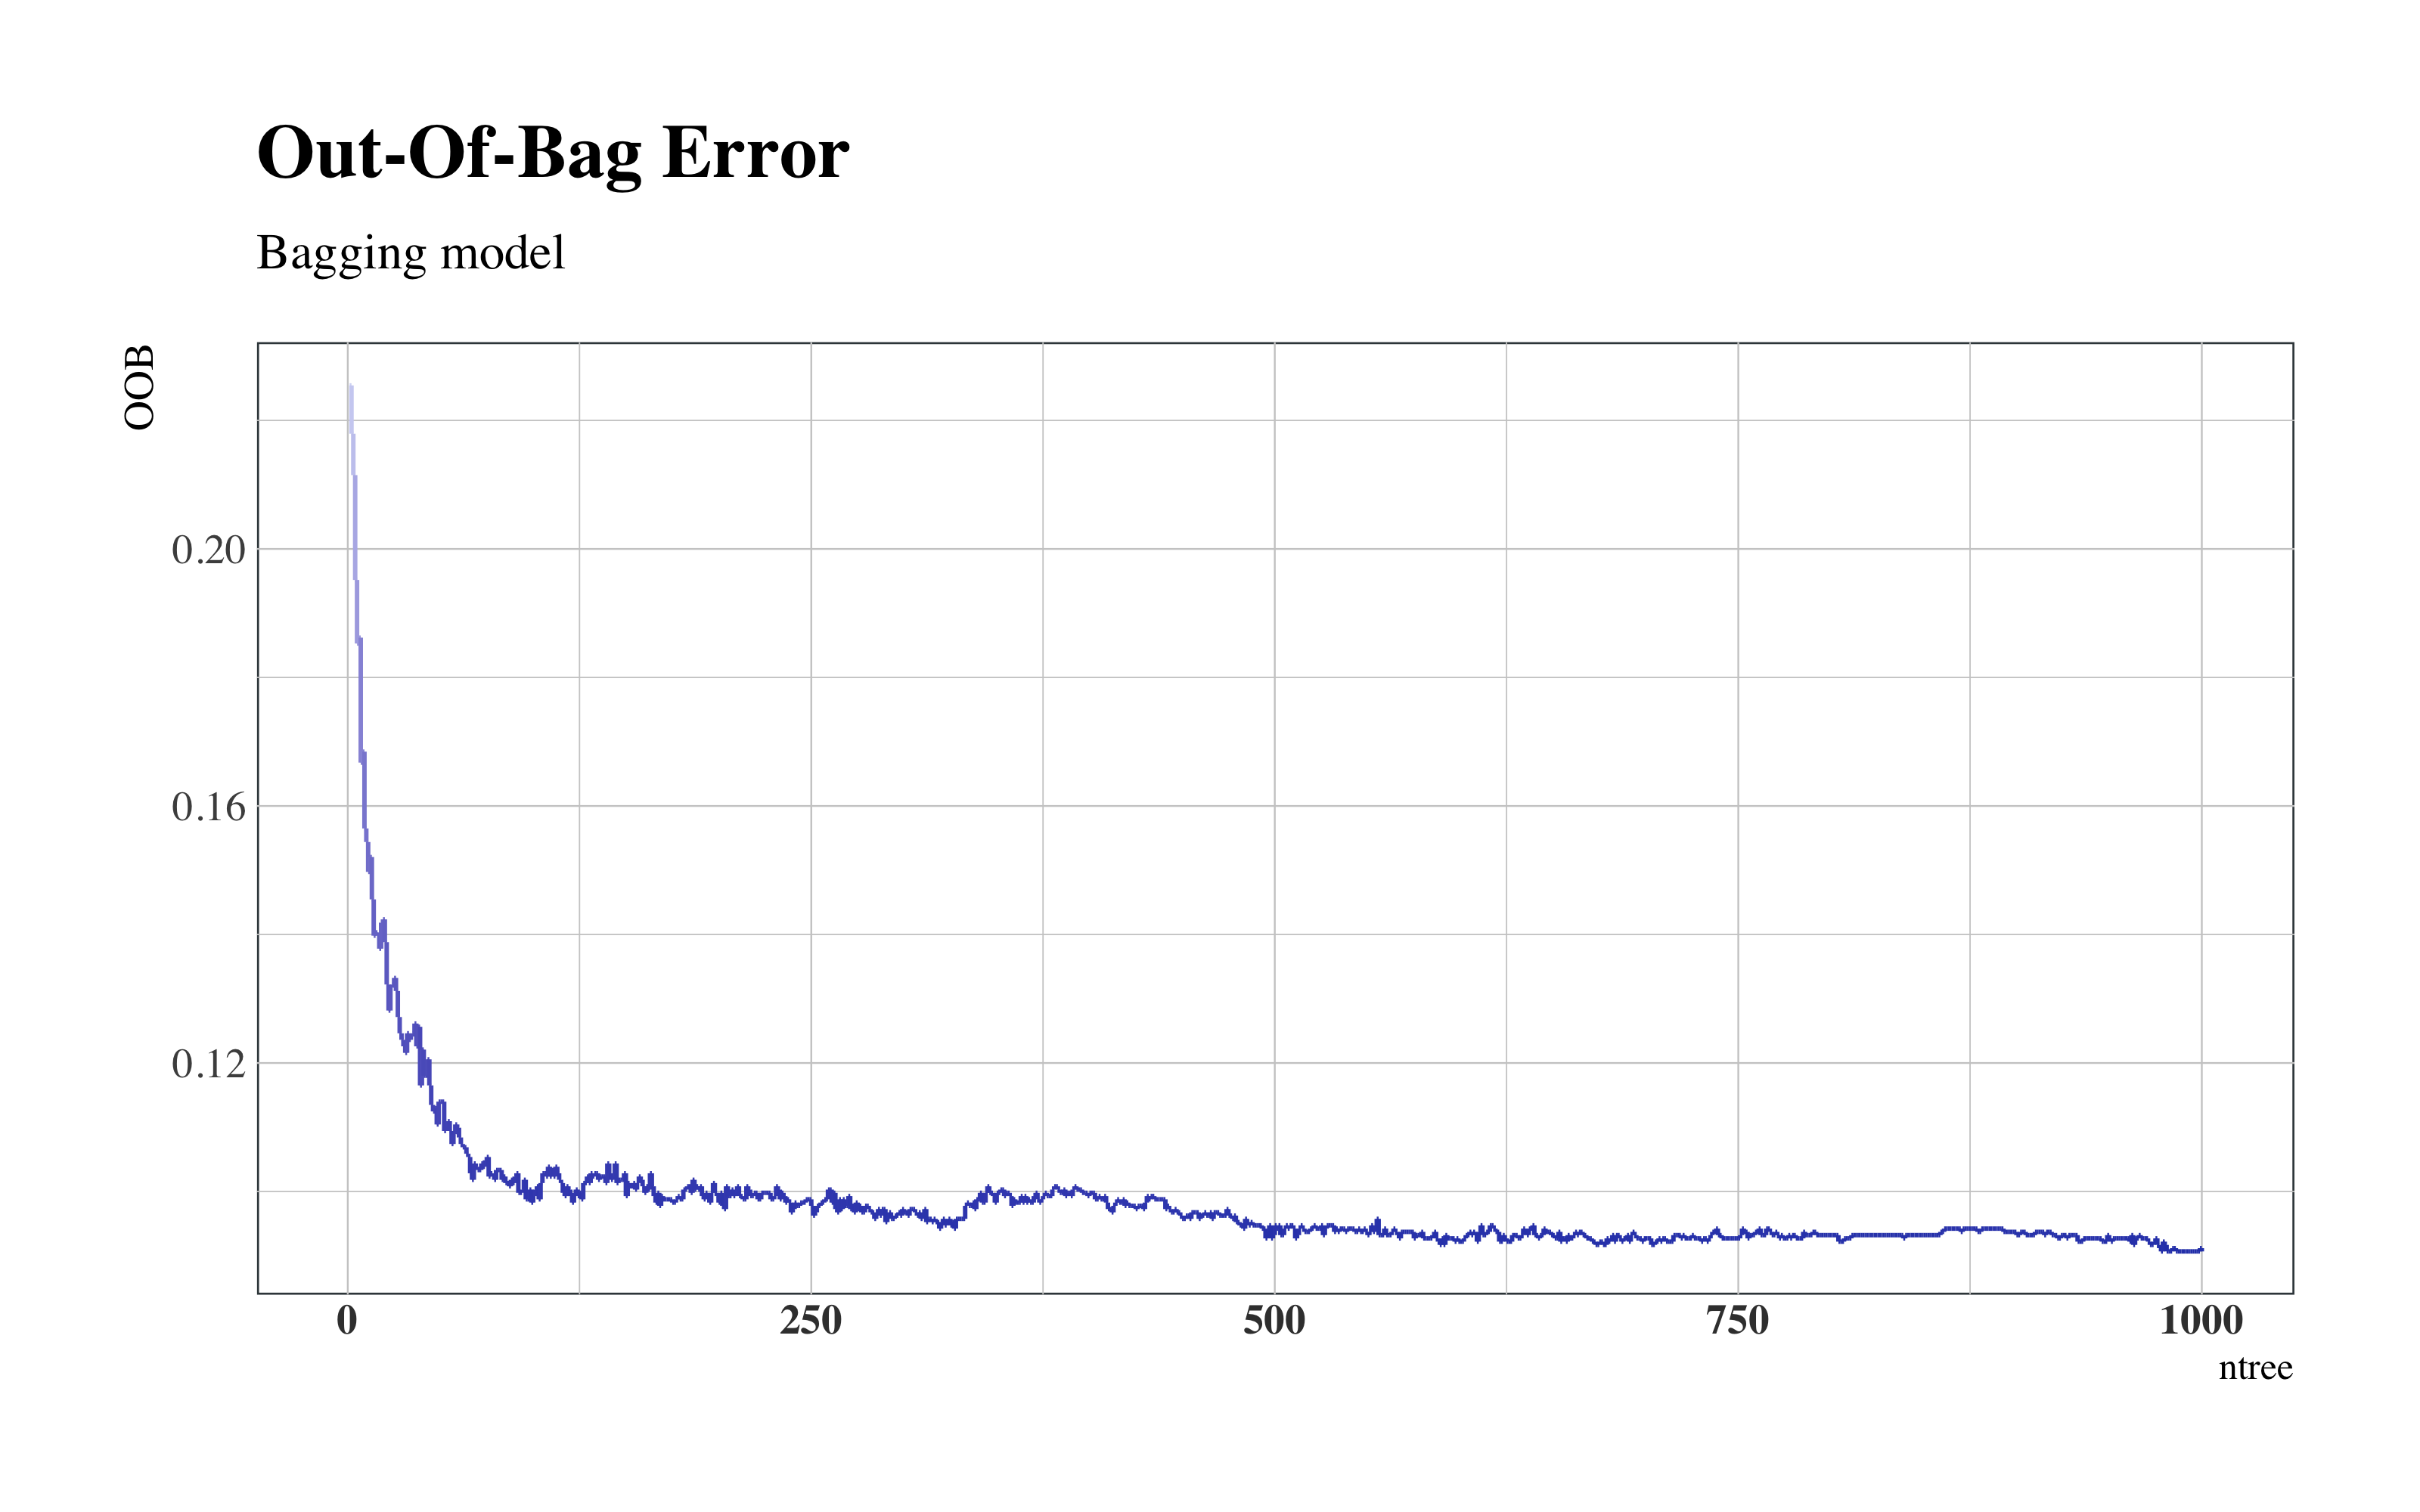
Bagging Out-Of-Bag Error
Se puede notar como el error menor se establece alrededor de un ntree=1000.
4.4.2.2 Matriz de Confusión y Importancia de Variables
draw_confusion_matrix(confusionMatrix(bg$predicted, bg$y), "#D6DBF5", "#2E45B8")

ggplot(vip::vi(bg) %>%
    filter(Importance > 25) %>%
    mutate(Variable = stringr::str_to_title(Variable)) %>%
    mutate(Variable = str_replace_all(Variable, "_", " ")), aes(x = reorder(Variable,
    Importance), y = Importance)) + ggchicklet::geom_chicklet(aes(fill = Importance),
    radius = grid::unit(6, "pt"), width = 0.8, show.legend = F) + labs(x = NULL,
    title = "Variable Importance Plot Bagging") + scale_y_continuous(position = "right") +
    scale_fill_gradient(low = "#D6DBF5", high = "#2E45B8") + coord_flip() + hrbrthemes::theme_ipsum(base_family = "Times",
    grid = "X") + theme(plot.title = element_text(vjust = -1), plot.margin = unit(c(0,
    1, 1, 0.5), "cm"))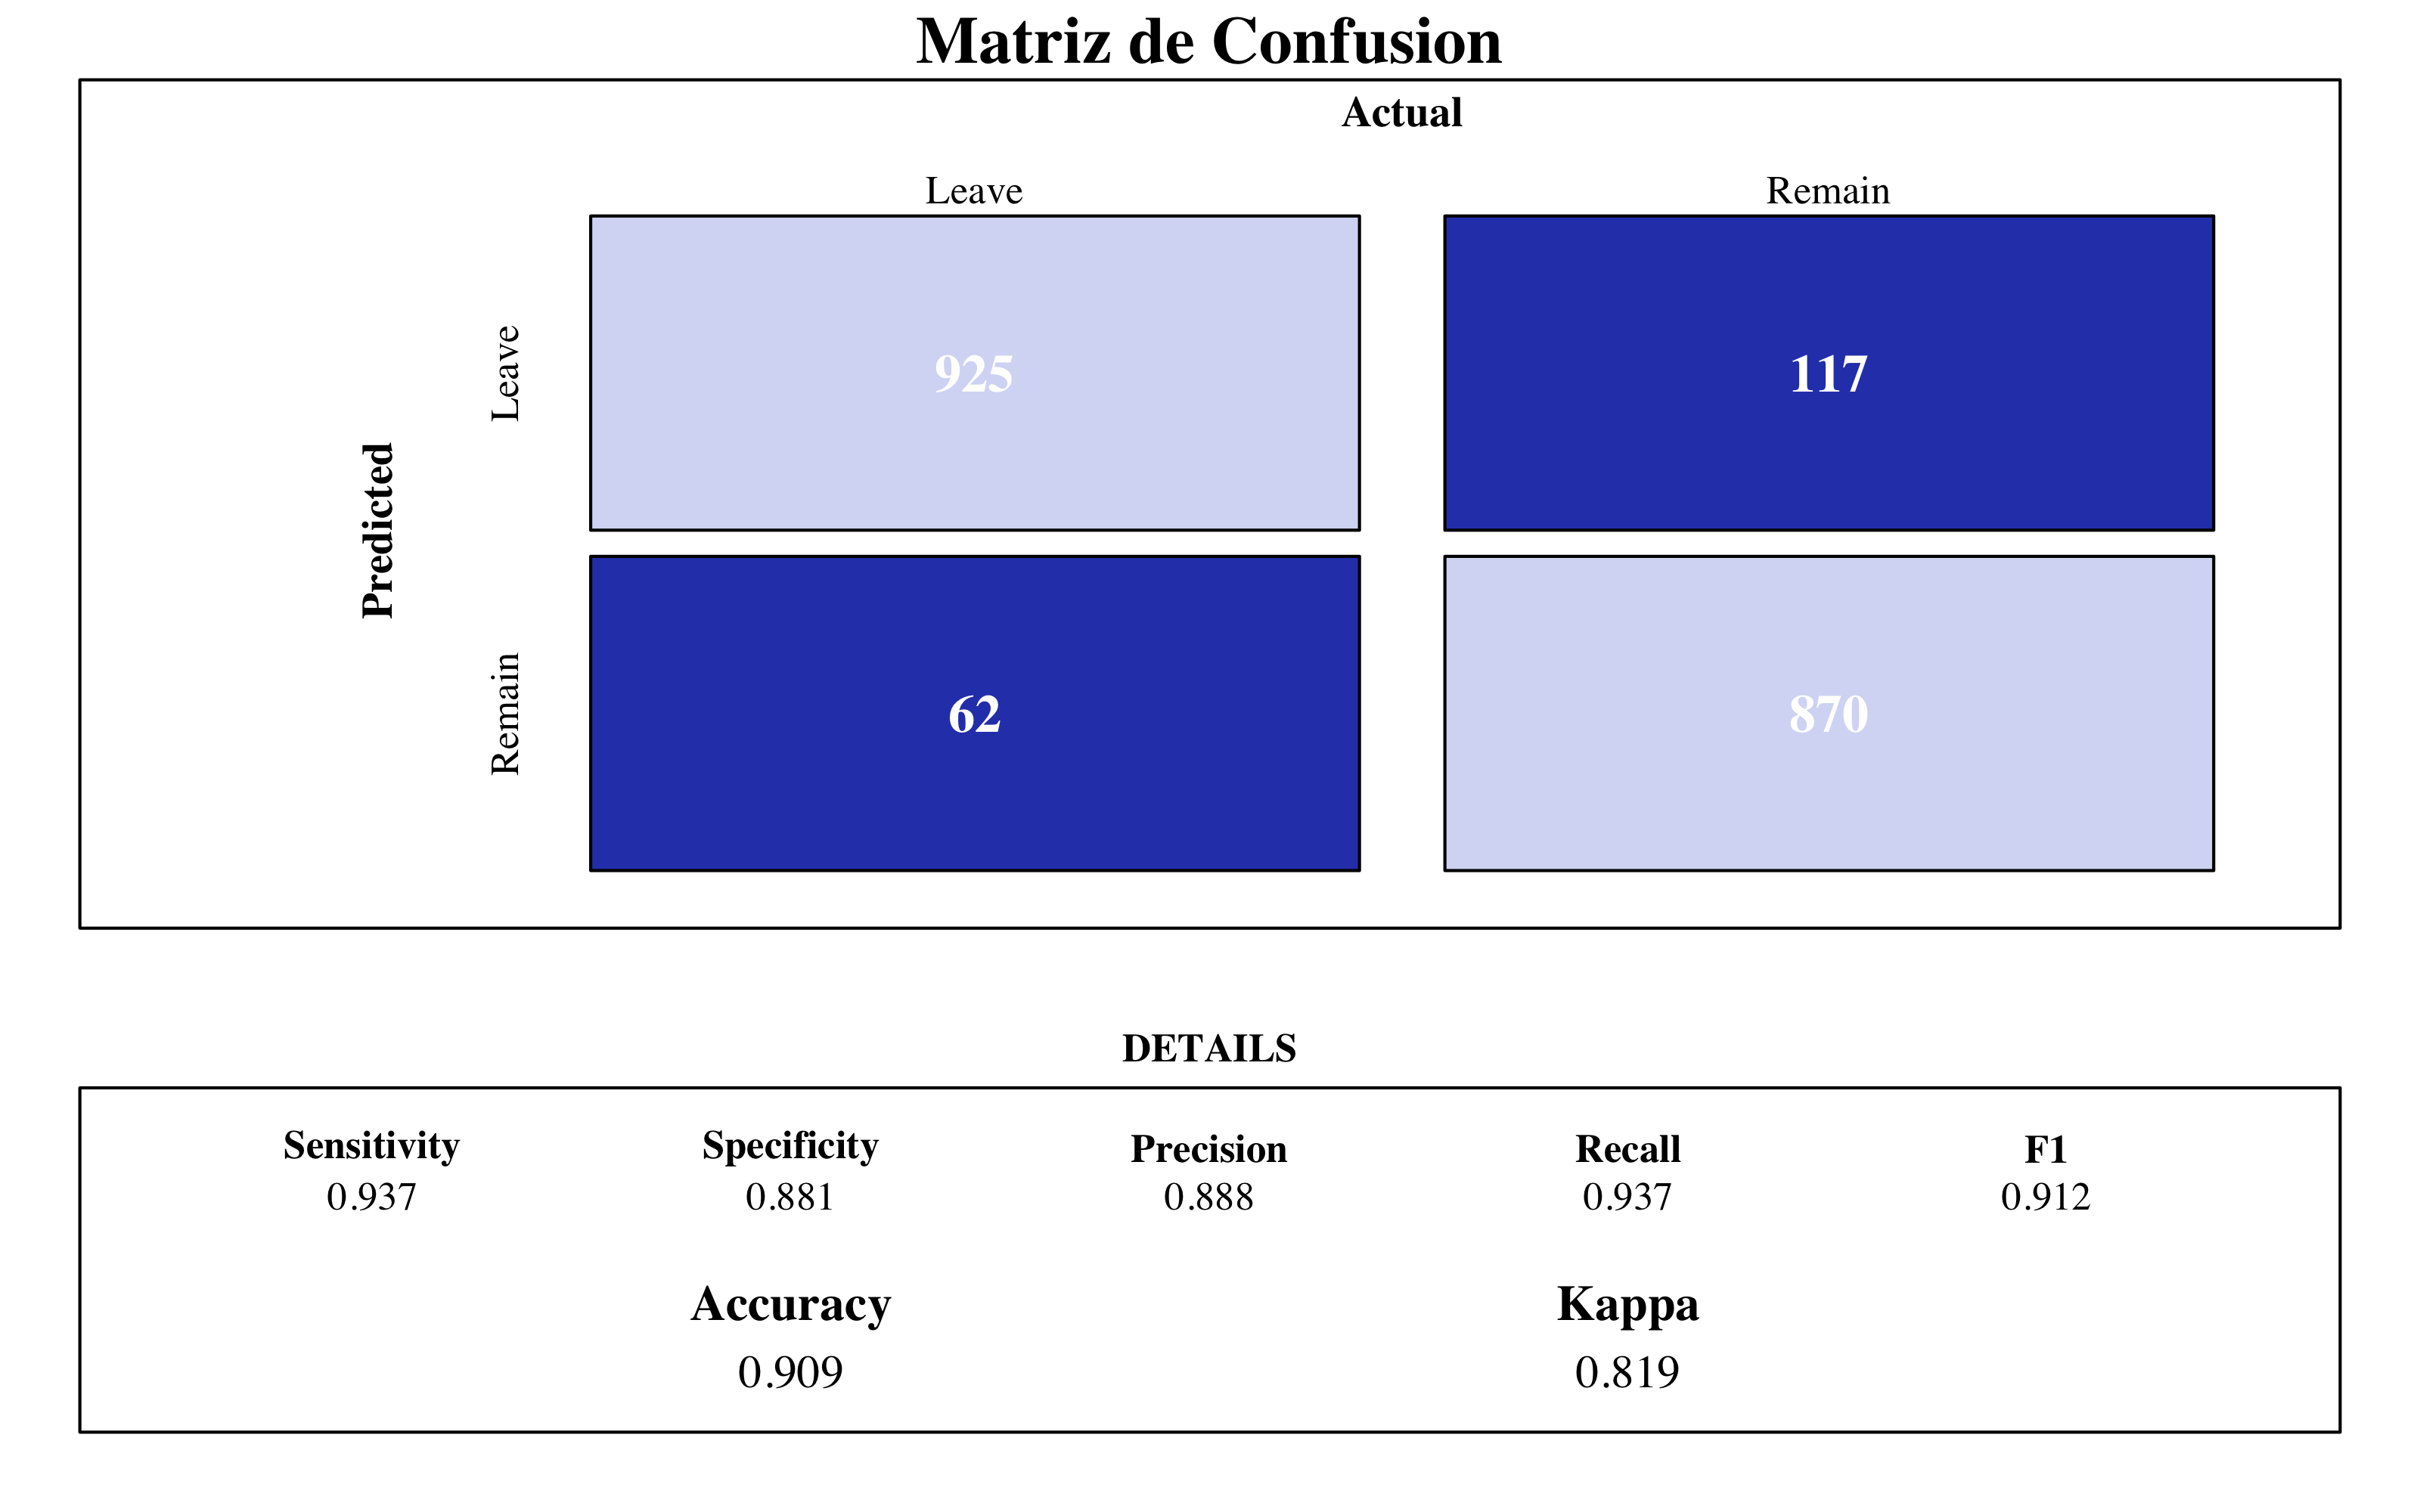
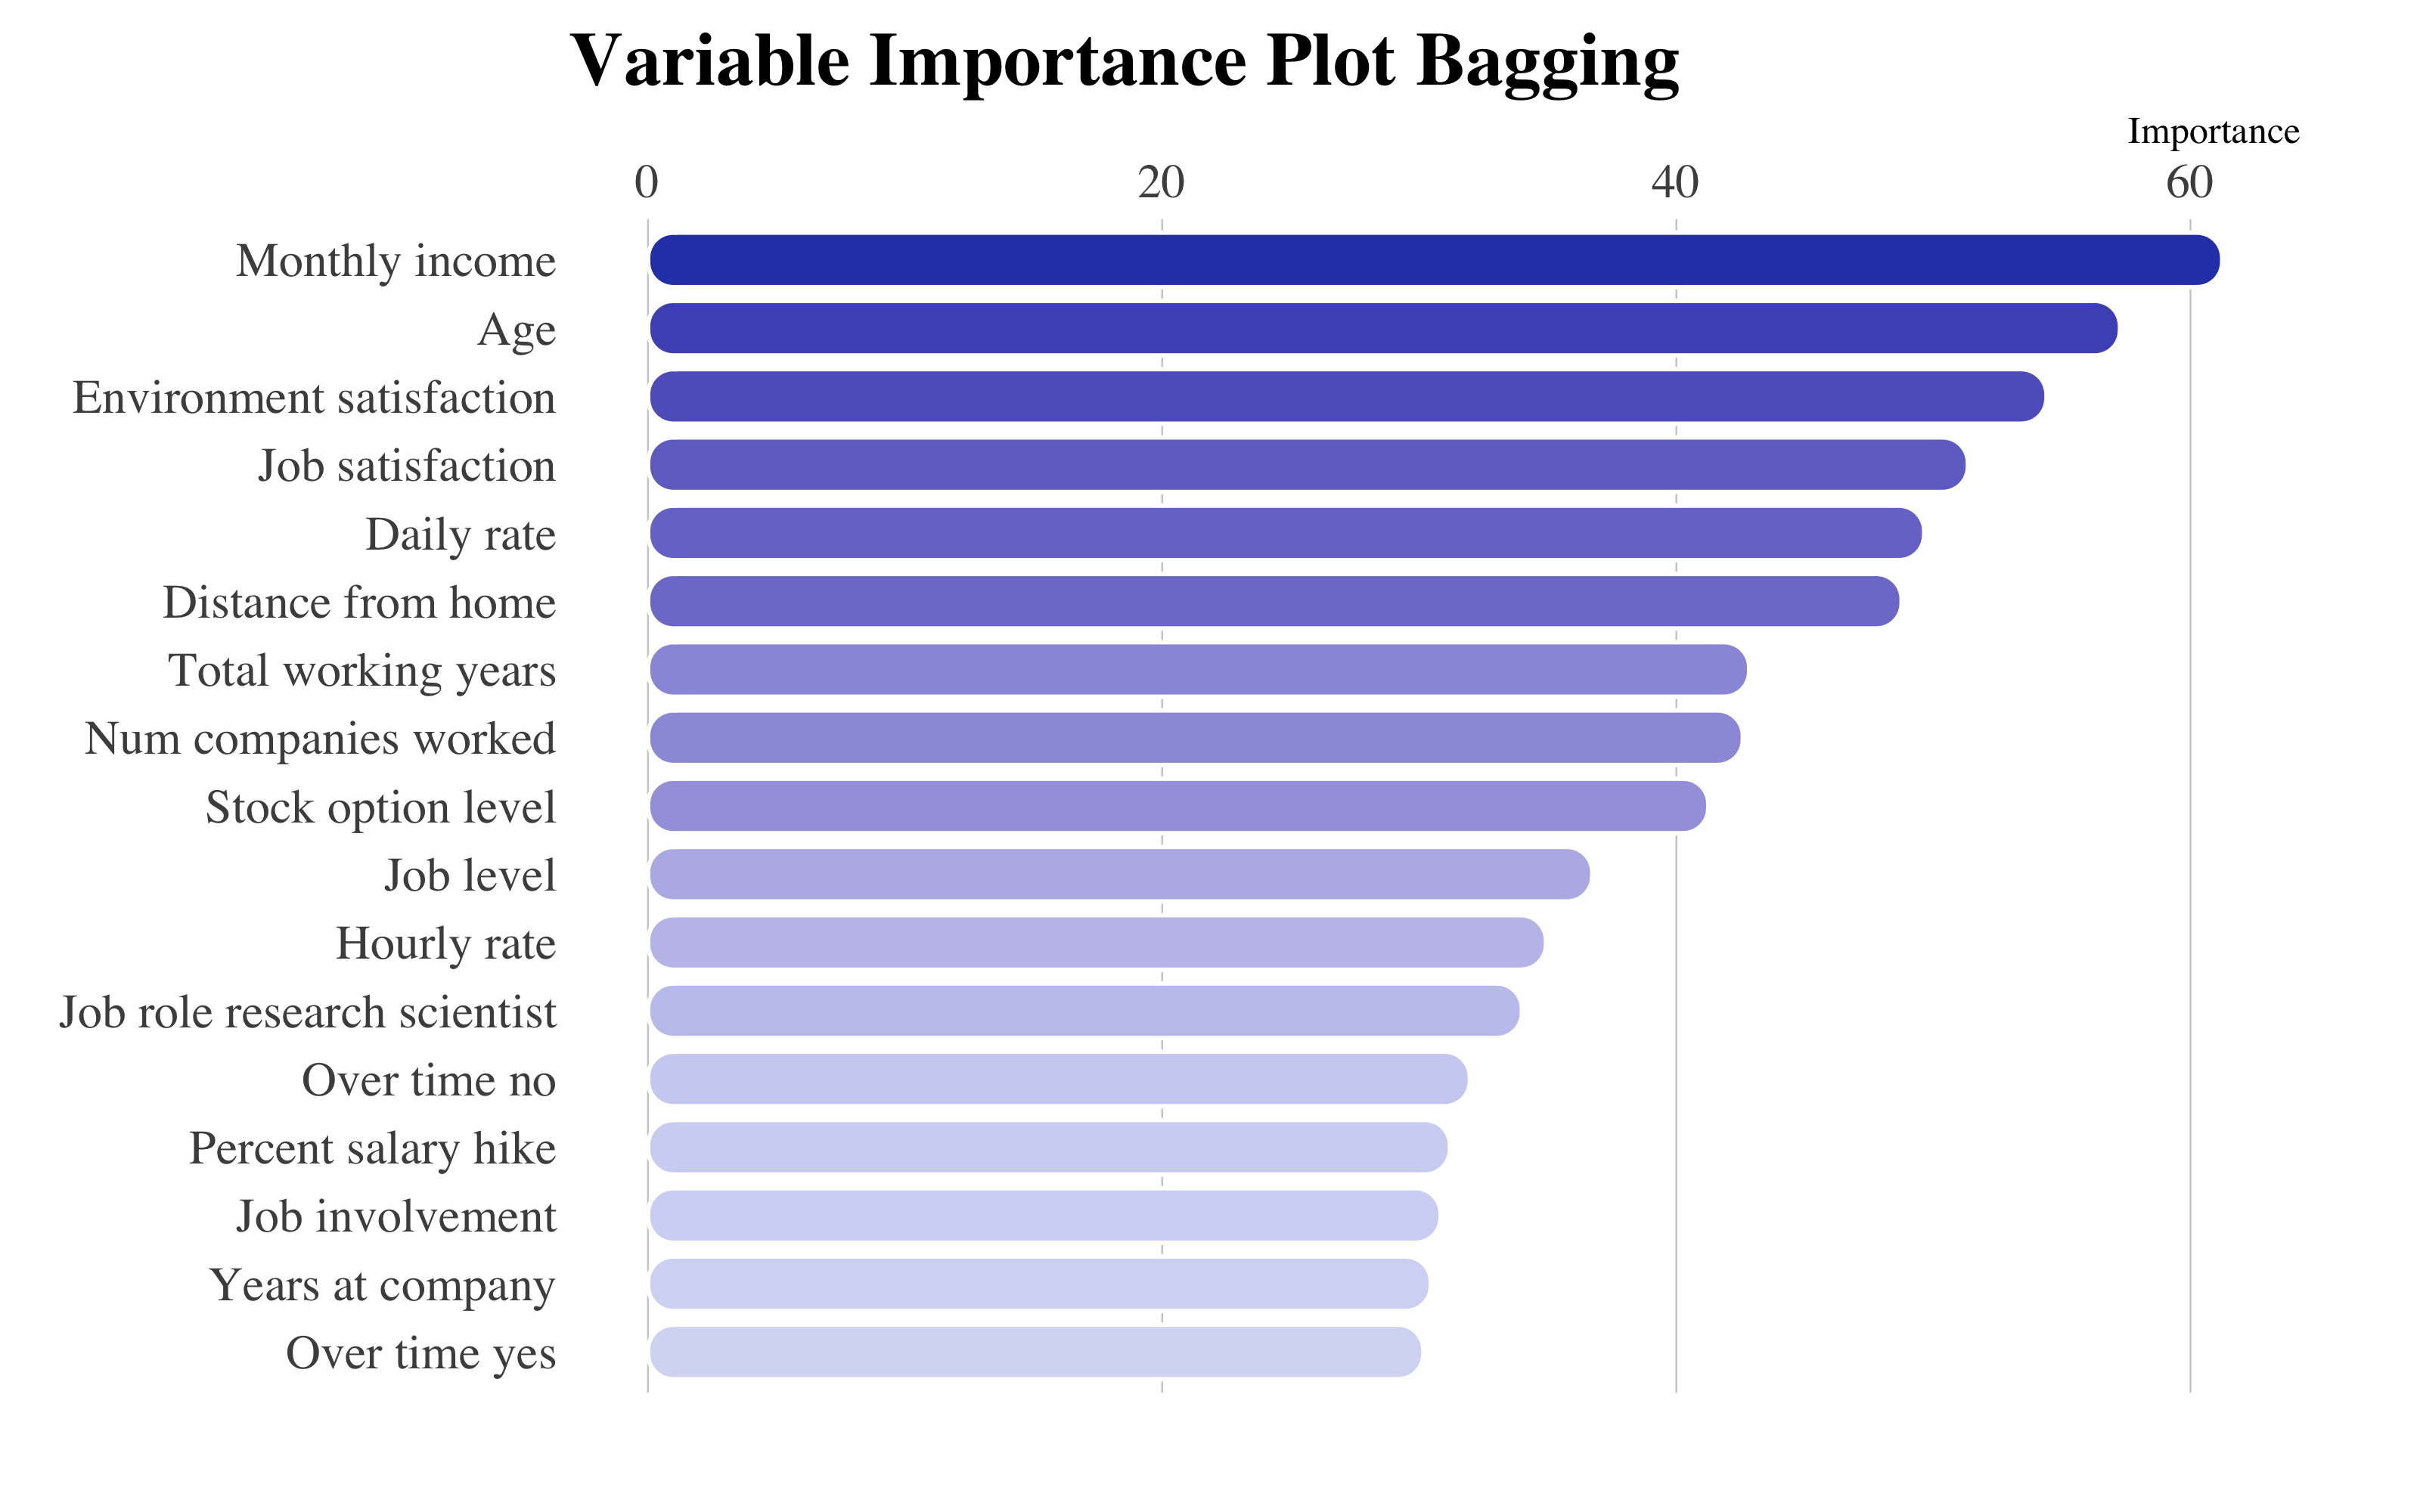
Bagging Final Model
Entre las muestras de las iteracciones calculadas, en promedio la variable más influyente es MonthlyIncome, el salario bruto de los empleados. En seguida, se encuentran JobSatisfaction y EnvironmentSatisfaction, es decir los nivel de satisfacción con el trabajo y su entorno en la empresa.
Hay que tener en cuenta que con la técnica de bagging, entre los árboles un par de variables serán en todos muy parecidos. Por esto, a través del random forest podemos añadir aleatoriedad en las variables entre los diferentes árboles, y esto también podrá reducir la varianza del modelo.
4.5 Random Forest
El algoritmo Random Forest, aprovechando de las ventajas del bagging, nos va a ayudar más a la hora de seleccionar las variables, por el hecho que esta técnica incorpora dos fuentes de variabilidad, el remuestreo de observaciones y de variables utilizadas en cada modelo. De esta manera podemos generalizar más, reduciendo el sobreajuste y conservando a la vez las relaciones particulares entre los datos.
4.5.1 Tuneo del Modelo
Para tunear los parámetros haré un bucle similar a como hecho previamente en la modelización del bagging. En este caso, tendré que tunear también el parámetro mtry, el numero de variables a seleccionar cada vez. Este parámetro si lo fijamos al máximo numero de variables, corresponderá a hacer el bagging.
4.5.1.1 Tuneo del modelo
registerDoParallel(makeCluster(3) -> cpu)

nodesize_ <- c()
sampsize_ <- c()
Accuracy <- c()
Kappa <- c()
Auc <- c()

tic()
for (nodesize in c(10, 20, 30, 40, 60, 50, 80, 100)) {
    for (sampsize in c(200, 350, 500, 800, 1000, 1200, 1350, 1570)) {
        rf <- train(data = upTrain, factor(attrition) ~ ., method = "rf", trControl = control,
            tuneGrid = expand.grid(mtry = c(5, 10, 20, 30, 40, 50)), ntree = 1000,
            sampsize = sampsize, nodesize = nodesize, replace = TRUE, linout = FALSE)

        cm <- confusionMatrix(rf$pred$pred, rf$pred$obs)

        roc <- roc(response = rf$pred$obs, predictor = rf$pred$Yes)

        Acc_i <- cm$overall[1]
        Accuracy <- append(Accuracy, Acc_i)

        K_i <- cm$overall[2]
        Kappa <- append(Kappa, K_i)

        Auc_i <- roc$auc
        Auc <- append(Auc, Auc_i)

        nodesize_ <- append(nodesize_, nodesize)
        sampsize_ <- append(sampsize_, sampsize)

        dput("---------------")
        dput(paste0("With nodesize= ", nodesize))
        dput(paste0("With sampsize= ", sampsize))
        dput(paste0("Accuracy: ", round(cm$overall[1], 3)))
        rf$results[1:3]
        print(roc$auc)
    }
}
toc()  #32 min. elapsed
stopCluster(cpu)

# Aggregate Metrics ----
rf_results = cbind(data.frame(Accuracy, Kappa, Auc, nodesize = nodesize_, sampsize = sampsize_))

# save(rf_results, file='rf_results.RData')
stopCluster(cpu)cbind(mtry = linebreak(c(45)), nodesize = c(20), sampsize = c(1570)) %>%
kable(format = "html", align = c(rep("l", 4)), bootstrap_options = "basic", caption = "Best Tune Random Forest") %>%
row_spec(0, monospace = T, font_size = 14)| mtry | nodesize | sampsize |
|---|---|---|
| 45 | 20 | 1570 |
He querido también visualizar las interacciones entre ellos:
library(htmltools)

# Render a bar chart with a label on the left
bar_chart <- function(
    label, width = "100%", height = "16px",
    fill = "#00bfc4", background = NULL){
       bar <- div(style = list(
                      background = fill,
                      width = width,
                      height = height))
       chart <- div(style = list(
                      flexGrow = 1,
                                    marginLeft = "8px",
                                    background = background),
                             bar)
       div(style = list(
             display = "flex",
             alignItems = "center"),
            label,
            chart)
}

reactable(
rf_results %>%
    mutate(nodesize = as_factor(nodesize),
                 sampsize = as_factor(sampsize)) %>%
    dplyr::group_by(nodesize, sampsize) %>%
    select(-Kappa) %>% summarize(
        Accuracy = mean(Accuracy),
        Auc = mean(Auc)),
defaultSorted = list(sampsize = "asc",
                                         nodesize = "desc"),
pagination = FALSE, highlight = TRUE, height = 450,
showSortIcon = TRUE, bordered = TRUE,
columns = list(

 Accuracy = colDef(
#   format = colFormat(digits = 2),
     name = "Accuracy",
   align = "left",
   cell = function(value){
     width <- paste0(value/1 * 100, "%")
     bar_chart(value,
                        width = width,
                        fill = "#2E45B8",
                        background = "#e1e1e1")}),

 Auc = colDef(
     name = "AUC",
     align = "left",
     cell = function(value){
        width <- paste0(value/1 * 100, "%")
    bar_chart(value,
                        width = width,
                        fill = "#2E45B8",
                        background = "#e1e1e1")})
    )
  )
Como podemos explorar a partir de la tabla, unos buenos parámetros serían nodesize=20 y sampsize=1570. Ahora miramos le andamiento del mtry:
# A partir del output del tuneo, he podido crear este dataframe
tribble(
   ~mtry, ~Accuracy, ~ Kappa,
    #----|----------|--------
    5,     0.912,     0.825,
    10,    0.918,     0.836,
    15,    0.926,     0.851,
    20,    0.920,     0.841,
    25,    0.930,     0.860,
    30,    0.923,     0.845,
    35,    0.929,     0.857,
    40,    0.919,     0.838,
    45,    0.931,     0.861,
    50,    0.920,     0.840,
) -> rf_result_mtry

# Plot ----
library(apexcharter)
apexchart(
    width = 830,
        ax_opts = list(
            chart = list(type = "line"),
            stroke = list(curve = "smooth"),
            grid = list(
                borderColor = "#e7e7e7",
                row = list(
                    colors = c("#f3f3f3", "transparent"),
                    opacity = 0.5
                )
            ),
            markers = list(style = "inverted", size = 4),
            series = list(
                list(name = "Accuracy",
                         data = rf_result_mtry$Accuracy),
                list(name = "Kappa",
                         data = rf_result_mtry$Kappa)
            ),
            title = list(text = "Tuneo Random Forest",
                                     align = "center"),
            xaxis = list(categories = rf_result_mtry$mtry)
        )
    ) %>%
    ax_subtitle(
        text = "Resultados remuestreo entre los parametros tuning",
        align = "center") %>%
    ax_yaxis(min = 0.815, max = 0.935) %>%
    ax_stroke(curve = "stepline", width = 2) %>%
    ax_colors("#4B69CE", "#B0BDE9")
Tuneo del mtry
Observamos que un numero de variables de 45 optimiza los valores.
4.5.2 Modelo final
library(randomForest)
rf <- randomForest(data = upTrain, factor(attrition) ~ ., mtry = 45, ntree = 2000,
    sampsize = 1570, nodesize = 20, replace = TRUE, importance = TRUE)
4.5.2.1 Out-Of-Bag Error
Queremos suficientes árboles para estabilizar el error pero usando demasiados árboles es innecesariamente ineficiente.
as.tibble(cbind(OOB = rf$err.rate[, 1], ntree = seq(1:nrow(rf$err.rate)))) %>%
    ggplot(aes(x = ntree, y = OOB)) + geom_step(aes(colour = OOB)) + scale_color_continuous(low = "#2E45B8",
    high = "#D6DBF5") + hrbrthemes::theme_ipsum(base_family = "Times", base_size = 10) +
    labs(title = "Out-Of-Bag Error", subtitle = "Random Forest model") + theme(legend.position = "none",
    panel.background = element_rect(color = "#3b454a"), title = element_text(face = "bold"),
    axis.title.y = element_text(size = 10), axis.text.x = element_text(face = "bold",
        colour = "#3D3D3D", size = 10))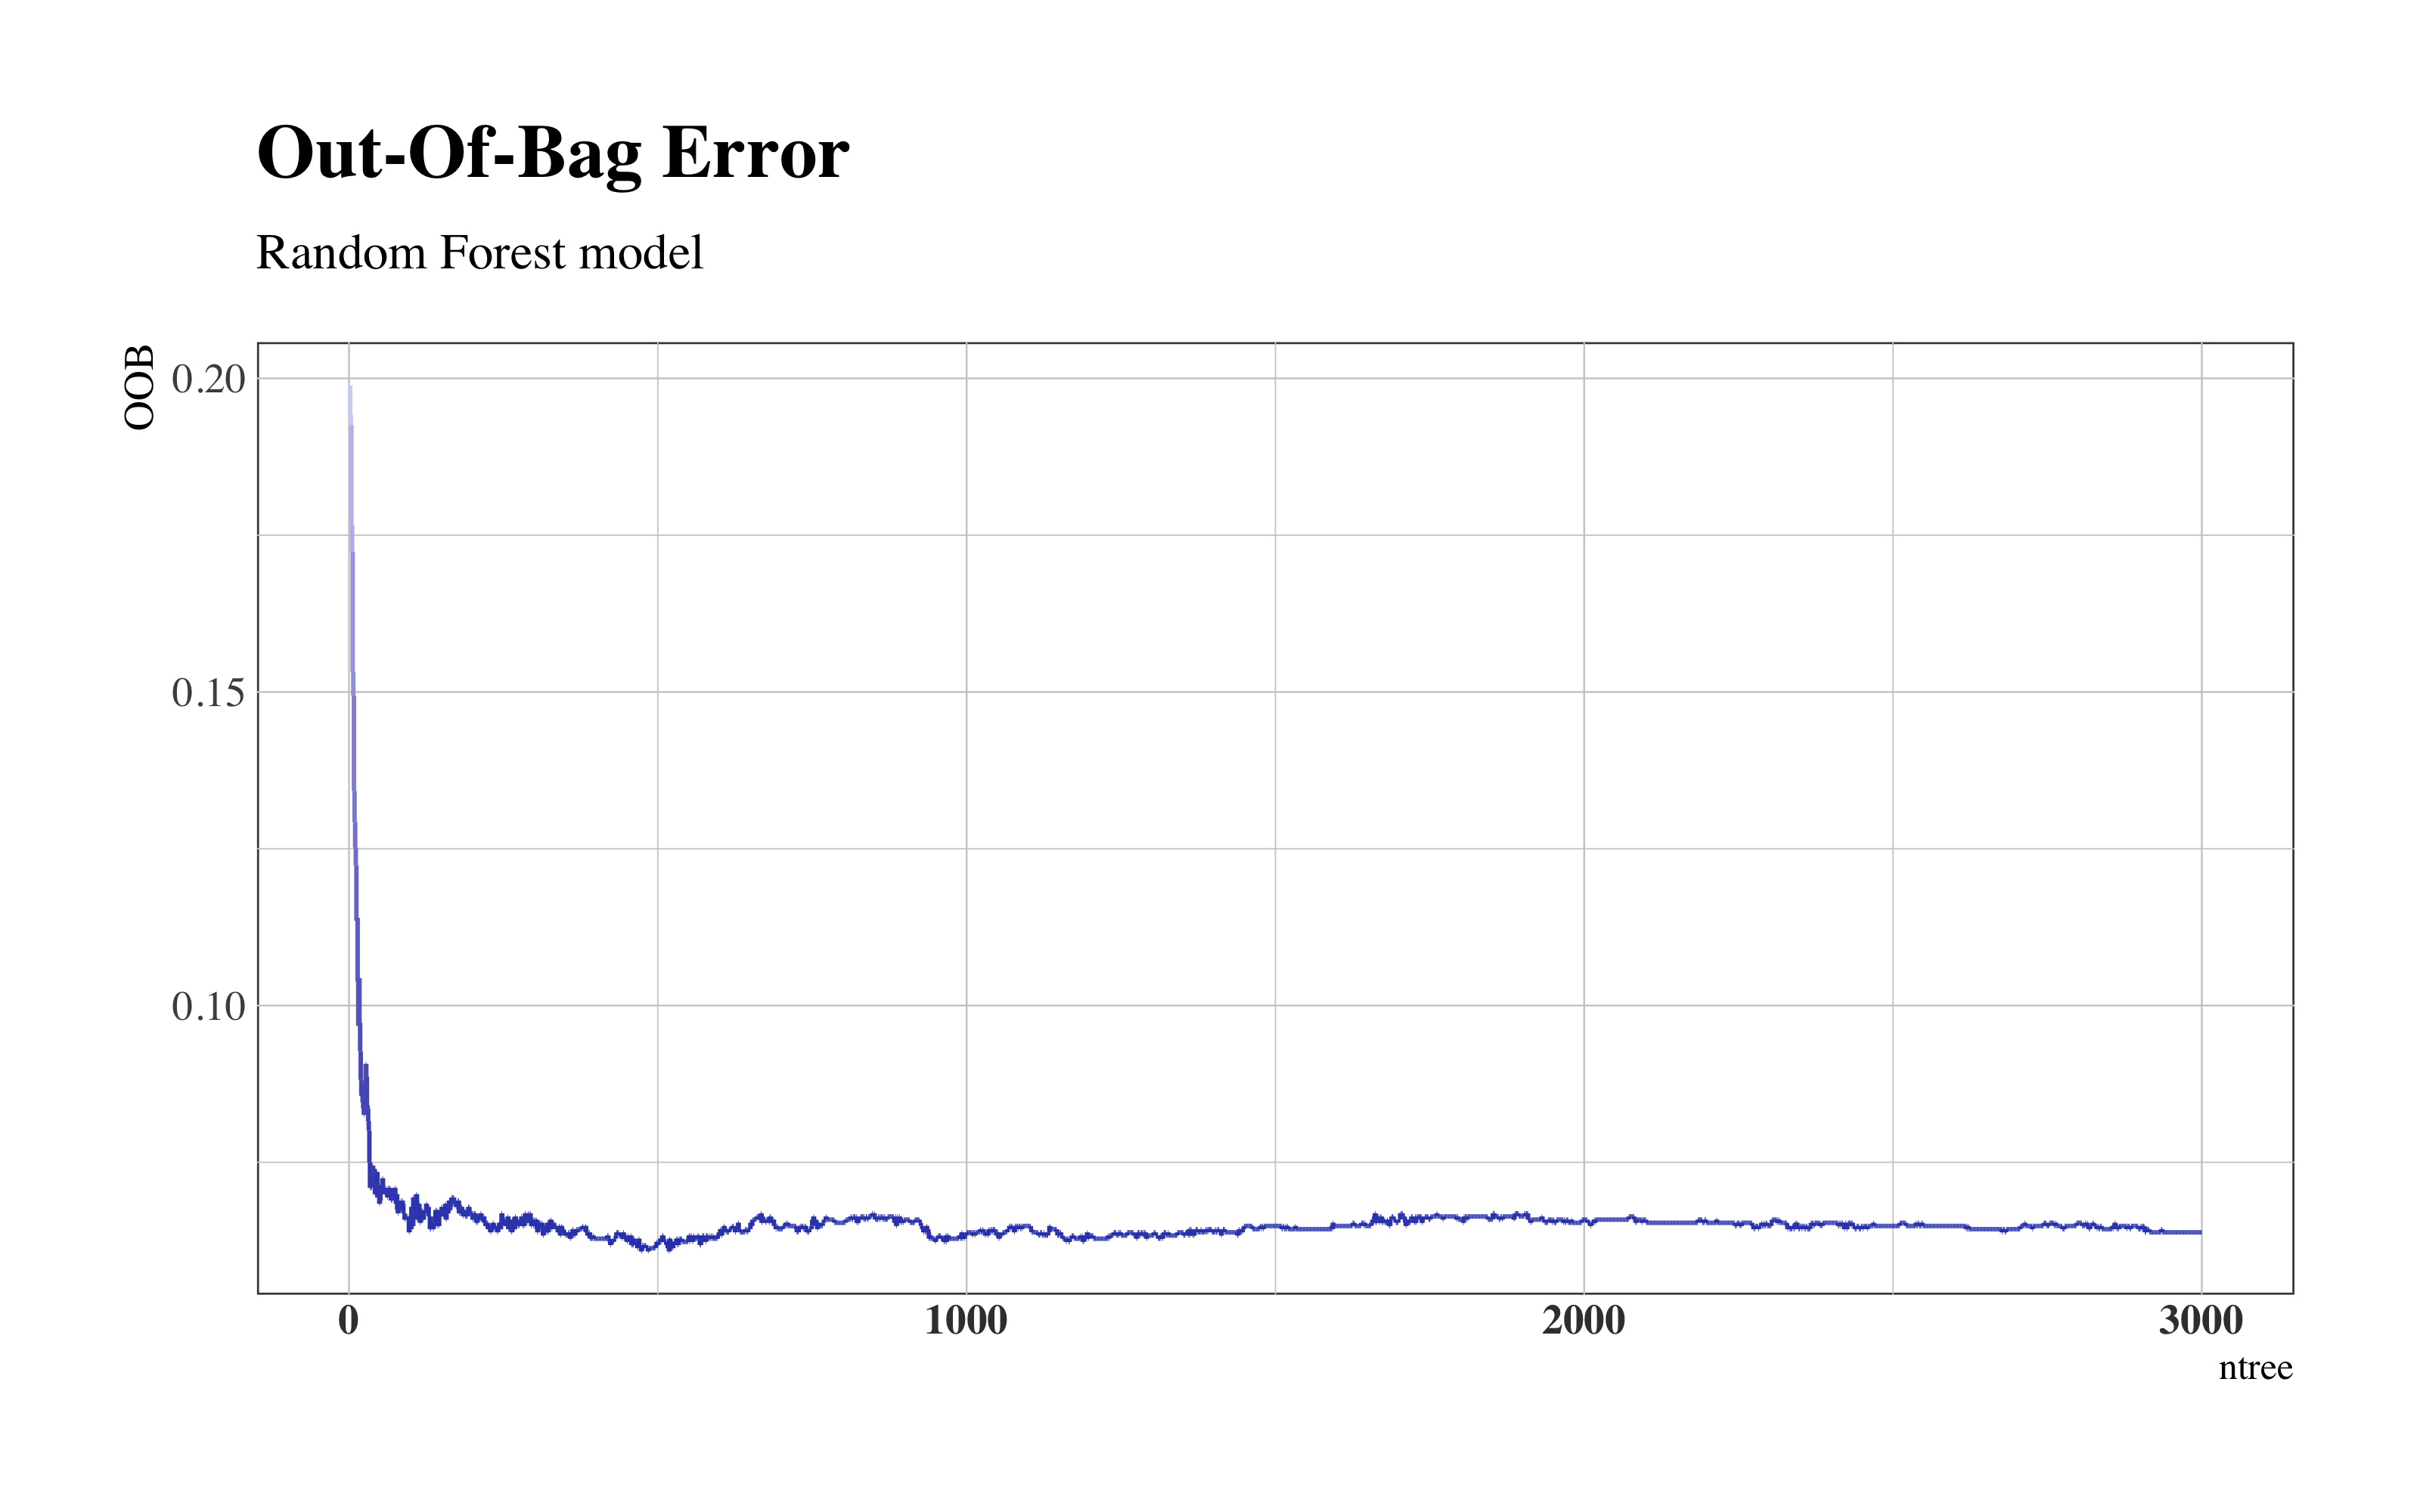
Random Forest Out-Of-Bag Error
De hecho, el error se establece entre de 1000 y 1500 árboles.
4.5.2.2 Matriz de Confusión y Importancia de Variables
draw_confusion_matrix(confusionMatrix(rf$predicted, rf$y), "#D6DBF5", "#2E45B8")

ggplot(vip::vi(rf) %>%
    filter(Importance > 30) %>%
    mutate(Variable = stringr::str_to_title(Variable)) %>%
    mutate(Variable = str_replace_all(Variable, "_", " ")), aes(x = reorder(Variable,
    Importance), y = Importance)) + ggchicklet::geom_chicklet(aes(fill = Importance),
    radius = grid::unit(6, "pt"), width = 0.8, show.legend = F) + labs(x = NULL,
    title = "Variable Importance Plot Random Forest") + scale_y_continuous(position = "right") +
    scale_fill_gradient(low = "#D6DBF5", high = "#2E45B8") + coord_flip() + hrbrthemes::theme_ipsum(base_family = "Times",
    grid = "X") + theme(plot.title = element_text(vjust = -1), plot.margin = unit(c(0,
    1, 1, 0.5), "cm"))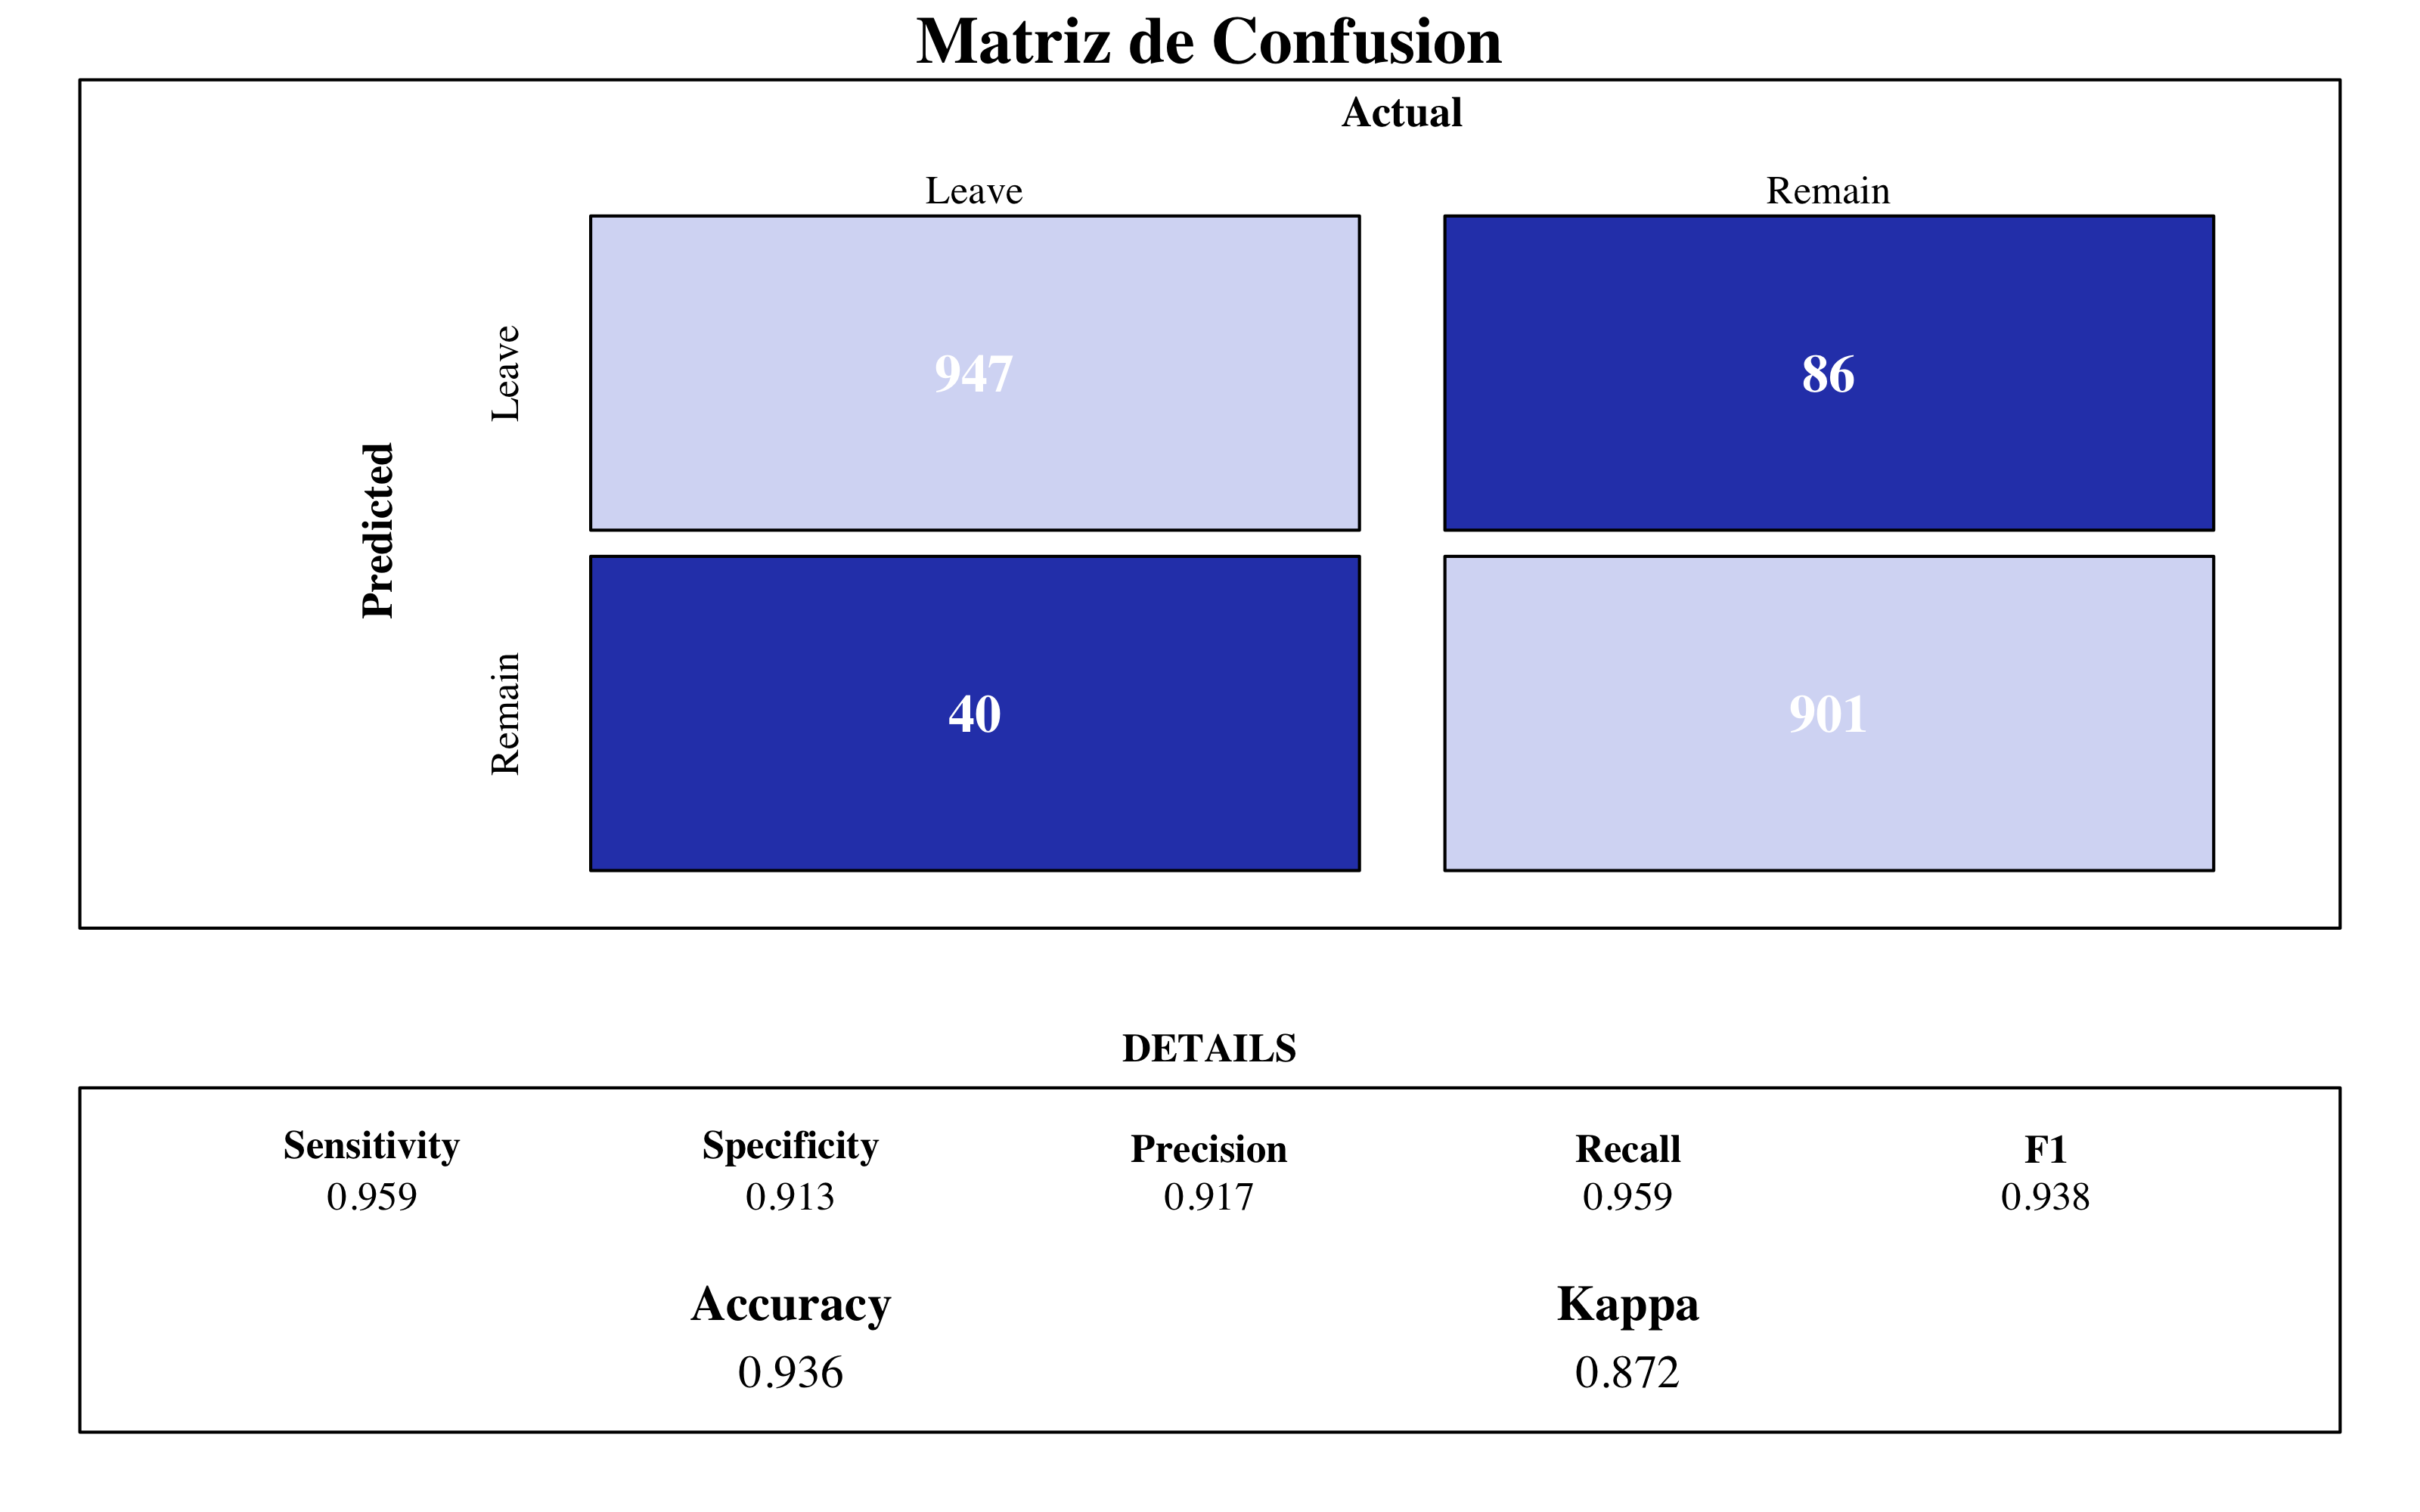
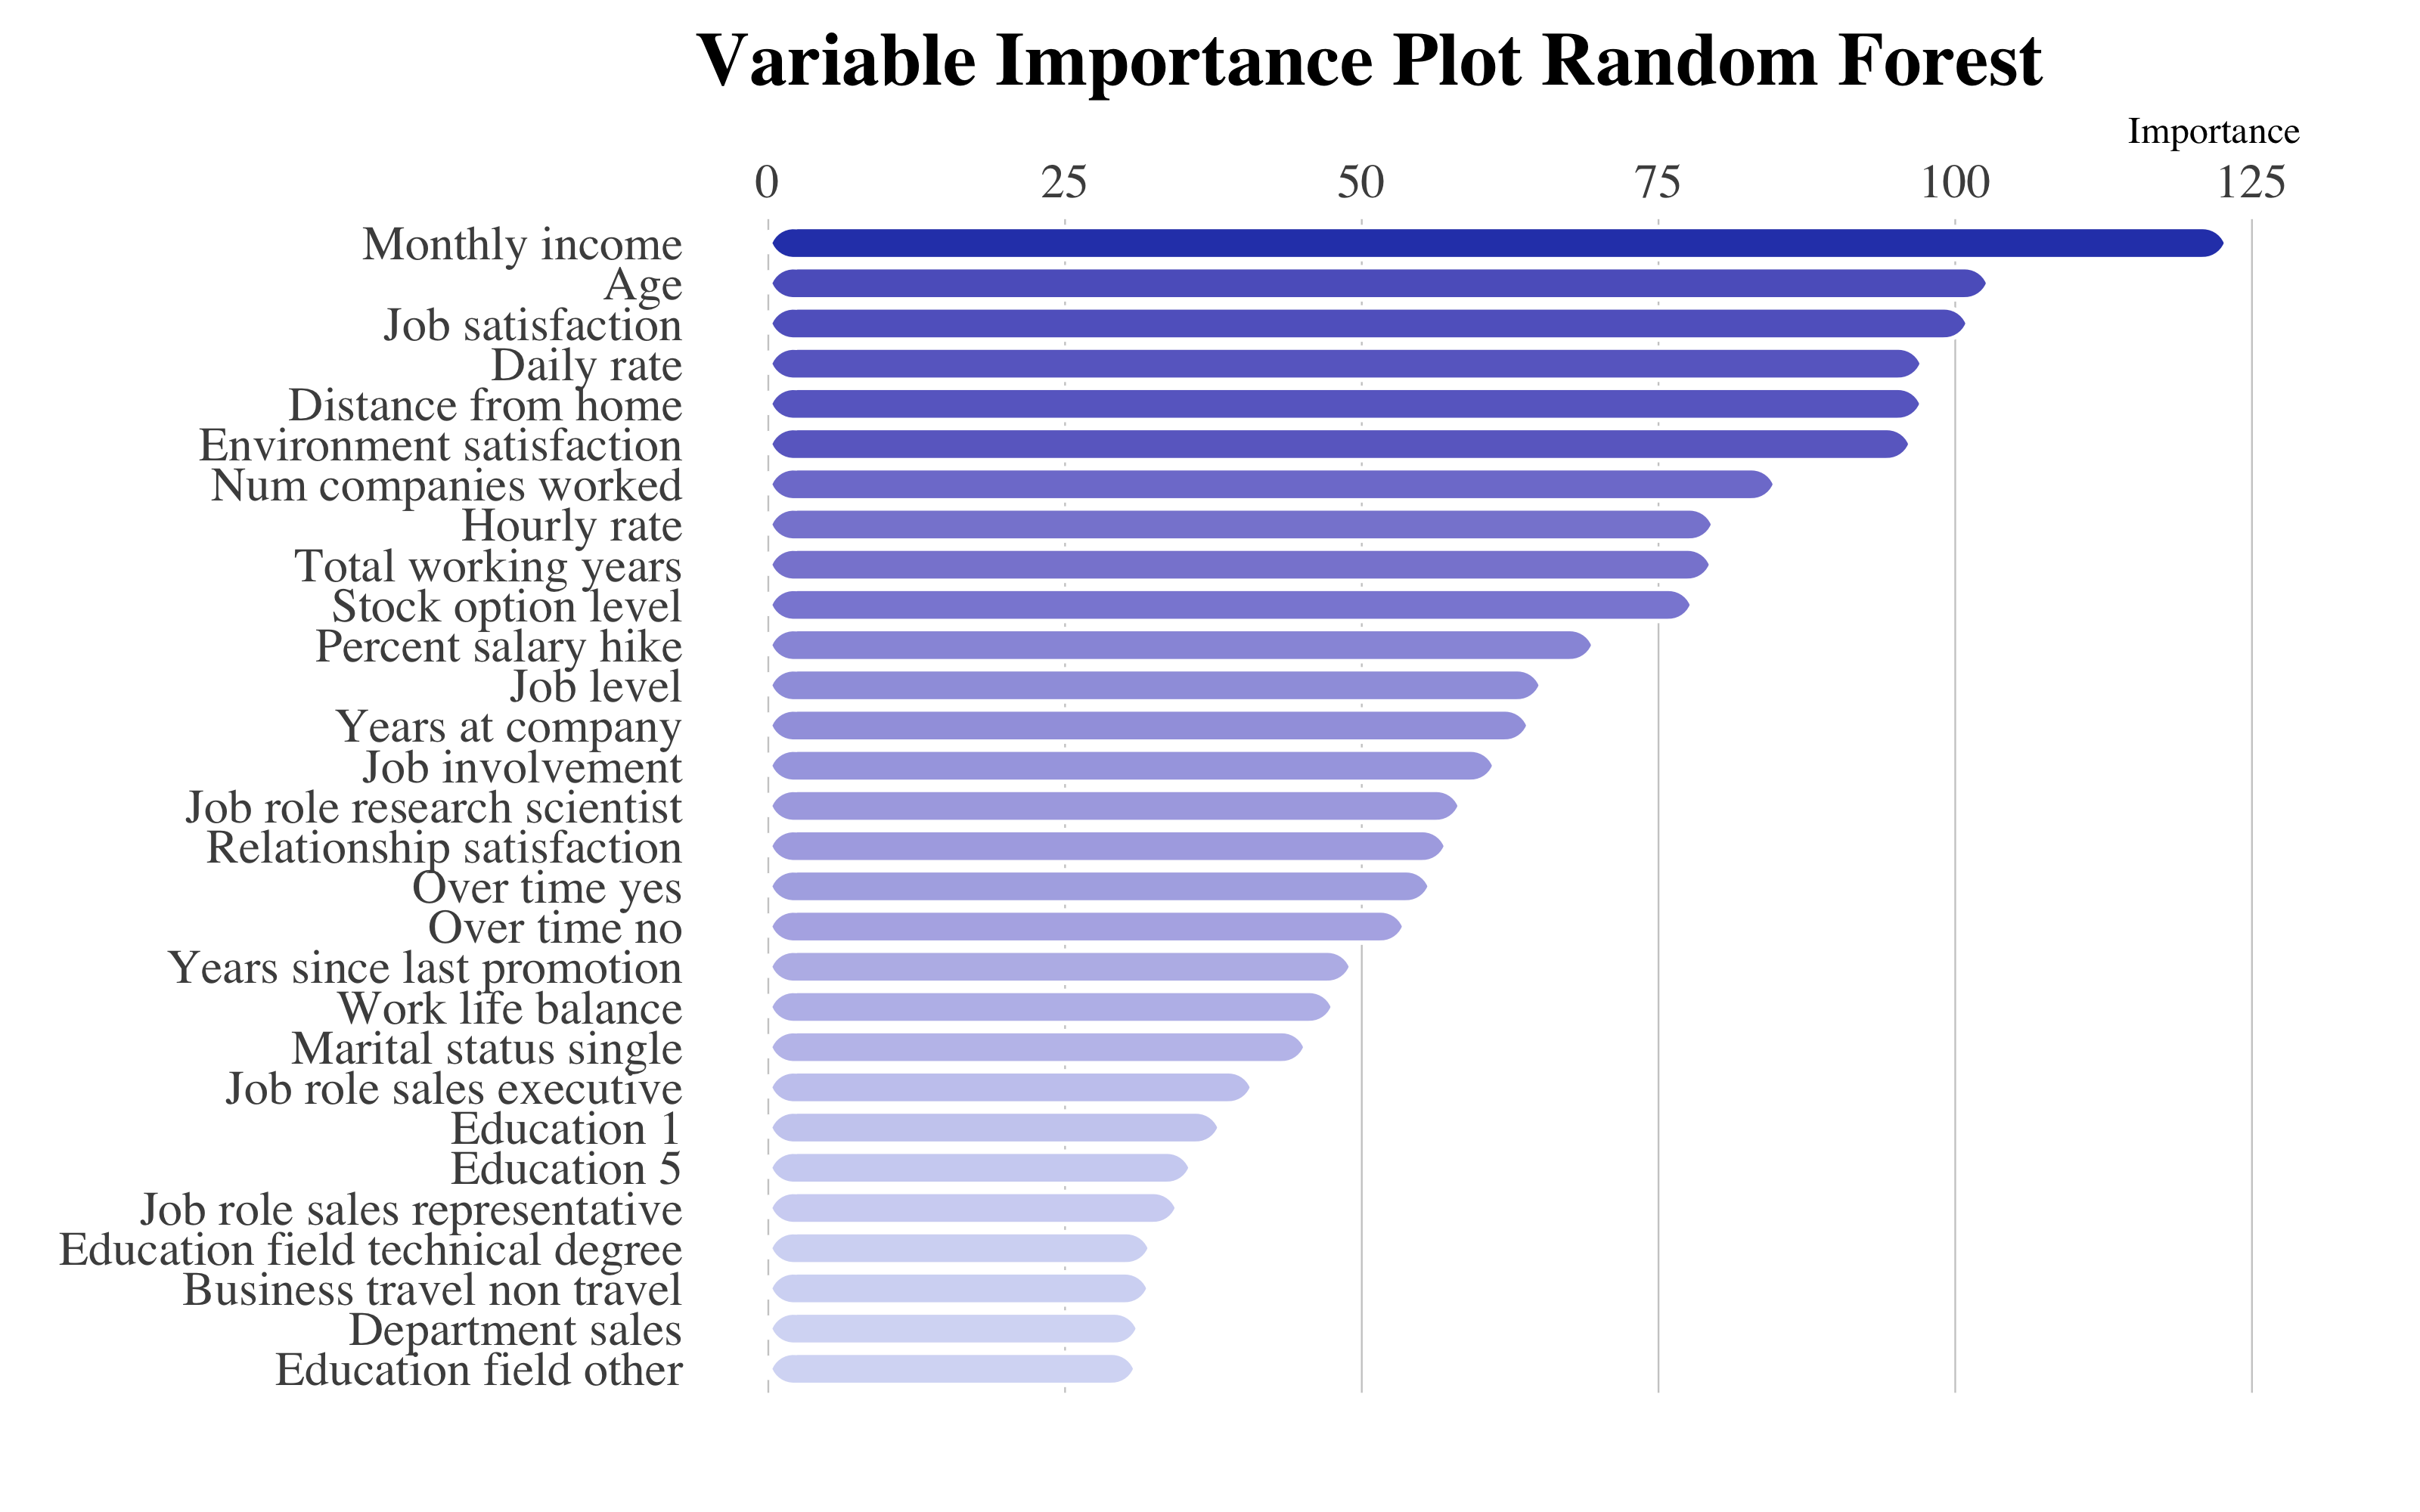
Random Forest Final Model
Similar con el modelo de bagging, la variable más influyente es el salario bruto de los empleados. Por la misma razón, DailyRate (la tarifa diaria de trabajo) toma mucha importancia. Encontramos también los niveles de satisfacción del trabajo y del entorno.
4.6 Gradient Boosting Machine
Los métodos que voy a emplear están basados sobre una estrategía diferente de construcción. A diferencia del random forest, que construye los modelos y luego los promedia, el gradient boosting machine construye los modelos secuencialmente. En cada iteración, se entrena un nuevo modelo de aprendizaje con respecto al error de todo el conjunto aprendido hasta ahora.
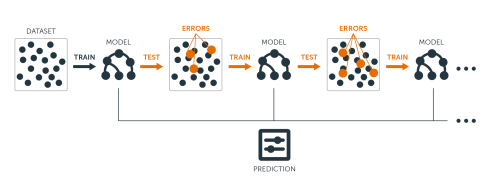
Gradient Boosting Machine construction method
4.6.1 Tuneo del Modelo
Una peculiaridad de este modelo es que podemos controlar muchos parámetros en el entrenamiento. La función modelLookup(), especificando el modelo ("gbm" en este caso) nos devuelve la lista.
library(kableExtra)
modelLookup("gbm")[2:3] %>%
    cbind(Description = linebreak(c("El número total de árboles para emplear.",
        "El número d de divisiones en cada árbol, este controla la complejidad del conjunto impulsado.",
        "Controla la rapidez con la que el algoritmo desciende hacía el gradient descent.",
        "Controla si utiliza o no una fracción de las observaciones de entrenamiento disponibles."))) %>%
    kable(format = "html", align = c(rep("l", 4)), caption = "Descripcion de los parámetros en GBM") %>%
    row_spec(0, font_size = 14) %>%
column_spec(1, monospace = T)| parameter | label | Description |
|---|---|---|
| n.trees | # Boosting Iterations | El número total de árboles para emplear. |
| interaction.depth | Max Tree Depth | El número d de divisiones en cada árbol, este controla la complejidad del conjunto impulsado. |
| shrinkage | Shrinkage | Controla la rapidez con la que el algoritmo desciende hacía el gradient descent. |
| n.minobsinnode | Min. Terminal Node Size | Controla si utiliza o no una fracción de las observaciones de entrenamiento disponibles. |
library(tictoc)
registerDoParallel(makeCluster(3) -> cpu)
tic()
gbm_results <- train(factor(attrition) ~ ., data = upTrain, method = "gbm", trControl = control,
    tuneGrid = expand.grid(shrinkage = c(0.01, 0.05, 0.1, 0.5, 1), n.minobsinnode = c(5,
        20, 35), n.trees = c(1000, 5000, 10000), interaction.depth = c(2)), distribution = "bernoulli",
    bag.fraction = 1, verbose = FALSE)
toc()  #17 min elapsed
stopCluster(cpu)
Podemos ver el comportamiento en ajuste del tuneo. La máxima accuracy se alcanza con estos valores:
r > Best Hyperparameters Tuning:r > [1] "List of 4" " |-n.trees : num 10000"
r > [3] " |-interaction.depth: num 2" " |-shrinkage : num 1"
r > [5] " |-n.minobsinnode : num 35"plot(gbm_results, output = "ggplot", "line", layout = c(3, 1), par.settings = list(superpose.line = list(lwd = 1,
col = c("#2A788E", "#2E45B8", "#440154")), superpose.symbol = list(pch = 19,
cex = 0.6, col = c("#2A788E", "#2E45B8", "#440154")), strip.background = list(col = "#D6DBF5")))
El numero de árboles construido es alto, pero eso nos lleva a una precisión más alta. El numero de observaciones en el nodo final puede ser bastante pequeño (minobsinnode = 20), no obstante he fijado para el modelo final el valor de 35, construyendo un modelo no demasiado complejo, con bajo sesgo y no tan alta varianza, pero más estable.
4.6.2 Modelo final
gbm <- train(factor(attrition) ~ ., data = upTrain, method = "gbm", trControl = control,
    tuneGrid = expand.grid(shrinkage = c(1), n.minobsinnode = c(35), n.trees = c(10000),
        interaction.depth = c(2)), distribution = "bernoulli", bag.fraction = 1,
    verbose = FALSE)
4.6.2.1 Matriz de Confusión y Importancia de Variables
draw_confusion_matrix(confusionMatrix(gbm$pred$pred, gbm$pred$obs), "#D6DBF5", "#2E45B8")

as_tibble(vip::vi(gbm)) %>%
    filter(Importance > 10) %>%
    mutate(Variable = stringr::str_to_title(Variable)) %>%
    mutate(Variable = str_replace_all(Variable, "_", " ")) %>%
    ggplot(aes(x = reorder(Variable, Importance), y = Importance)) + ggchicklet::geom_chicklet(aes(fill = Importance),
    radius = grid::unit(6, "pt"), width = 0.8, show.legend = F) + labs(x = NULL,
    title = "Variable Importance Plot Gradient Boosting") + scale_y_continuous(position = "right") +
    scale_fill_gradient(low = "#D6DBF5", high = "#2E45B8") + coord_flip() + hrbrthemes::theme_ipsum(base_family = "Times",
    grid = "X") + theme(plot.title = element_text(vjust = -1), plot.margin = unit(c(0,
    1, 1, 0.5), "cm"))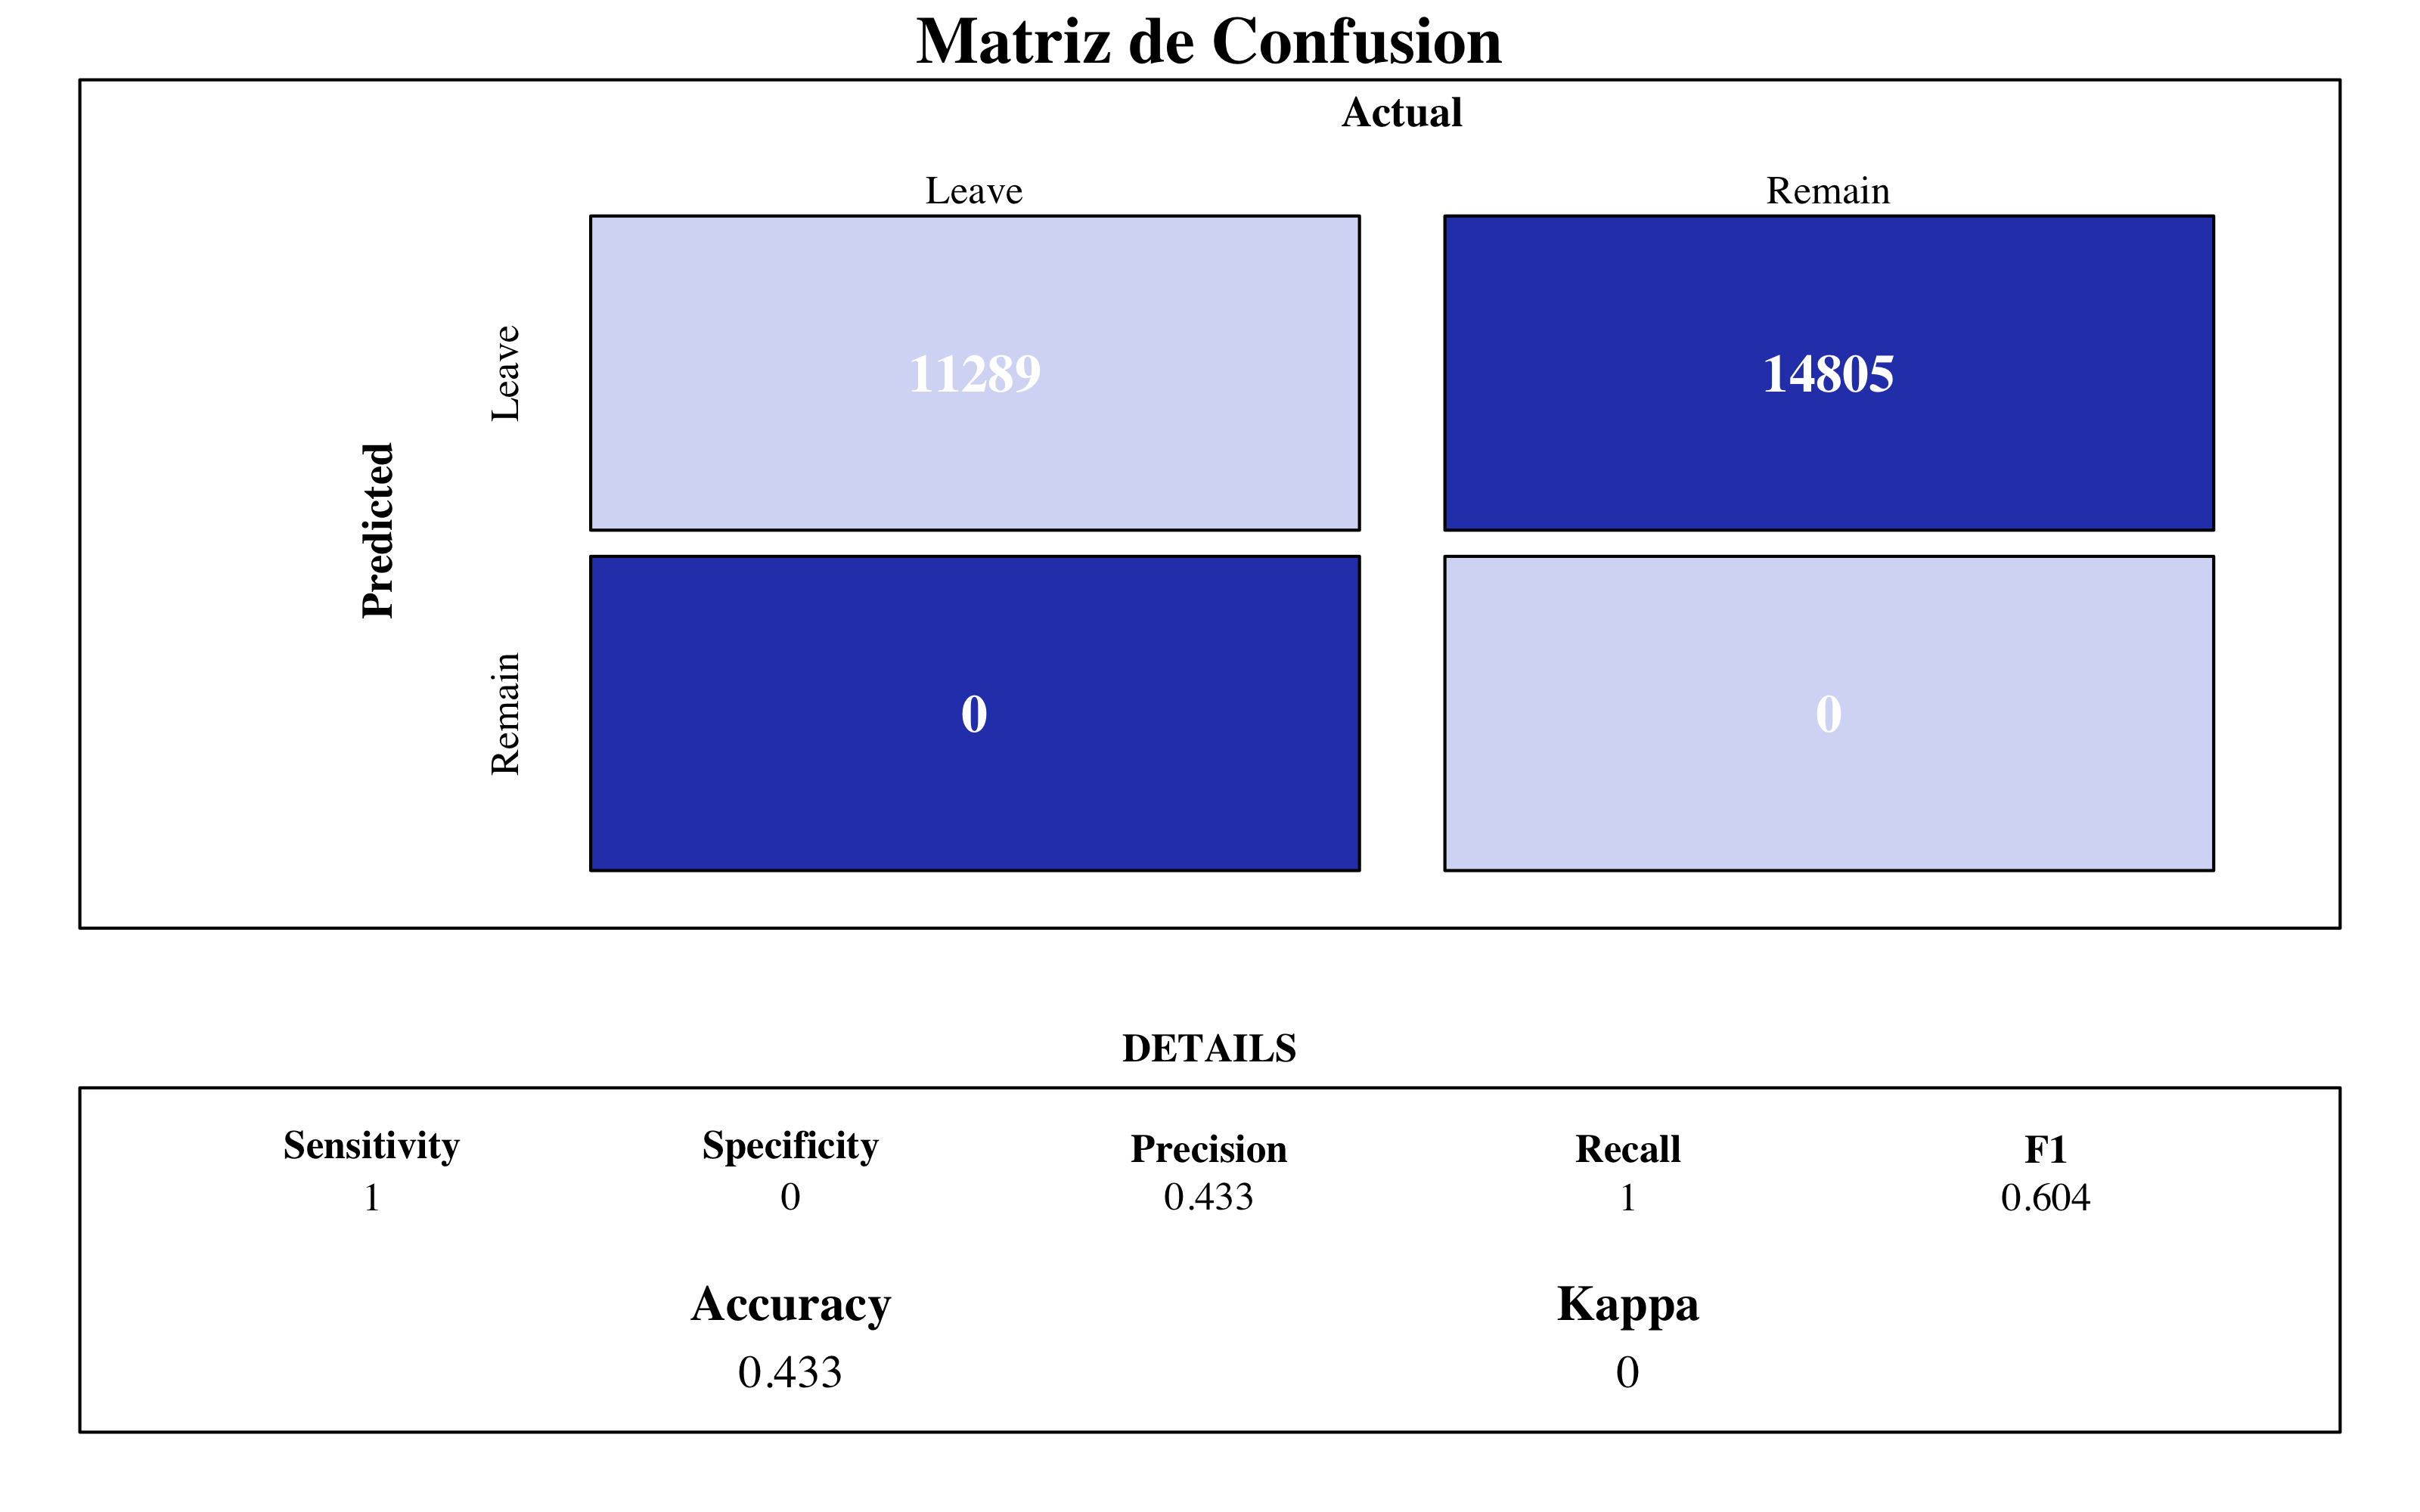
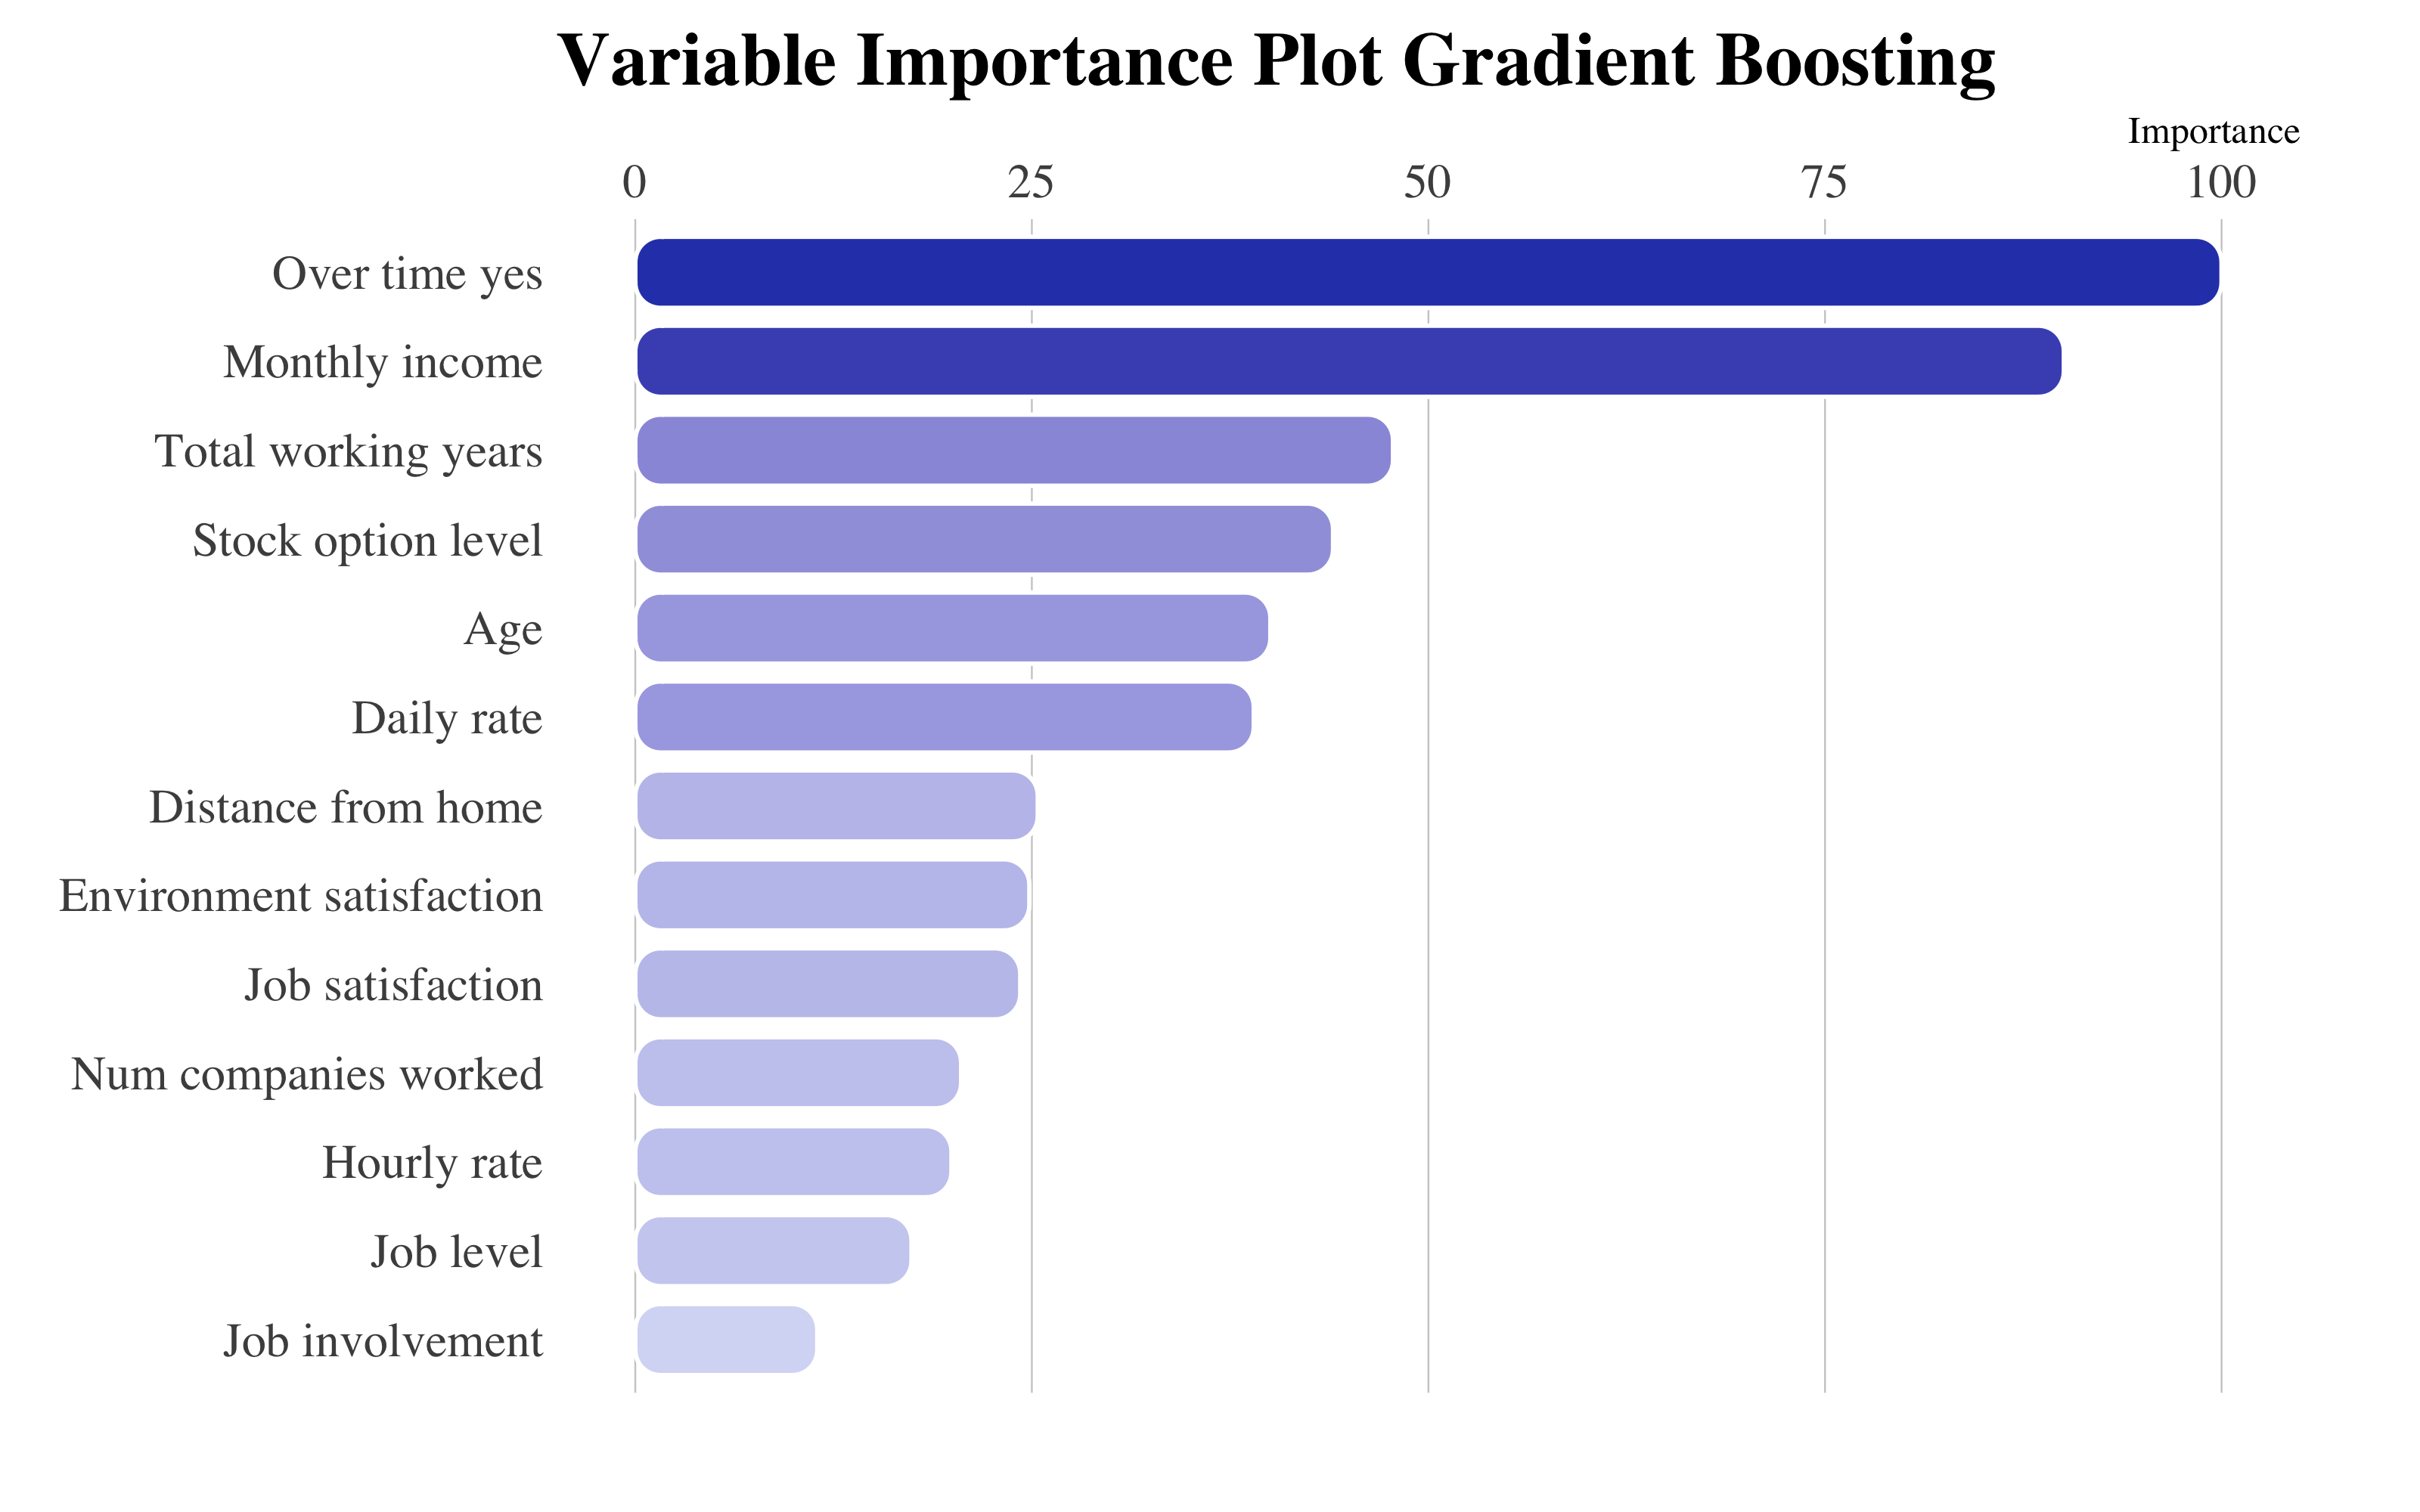
GBM Final Model
A partir del gráfico de importancia de variables, destaca la variable OverTime_yes y MonthlyIcome, que juntas a StockOptionLevel y DailyRate nos confirmas que las retribuciones juegan un rol importante a la hora de decidir si dejar la empresa o no.
4.7 XGBoost
4.7.1 Tuneo del Modelo
modelLookup("xgbTree")[2:3] %>%
    cbind(Description = linebreak(c("El número total de árboles para emplear",
        "Se utiliza para controlar el sobreajuste ya que un valor mayor permitirá que el modelo aprenda relaciones muy específicas para una muestra particular.",
        "Hace el modelo más robusto reduciendo los pesos en cada paso.", "Controla si utiliza o no una fracción de las observaciones de entrenamiento disponibles.",
        "Gamma especifica la reducción positiva mínima en la loss función requerida para hacer una división del nodo.",
        "Denota las columnas a remuestrar para cada árbol.", "Define la suma mínima de pesos de todas las observaciones requeridas en un child node. Por valores superiores impiden que un modelo aprenda relaciones que podrían ser muy específicas."))) %>%
    kable(format = "html", align = c(rep("l", 4)), bootstrap_options = "basic", caption = "Descripcion de los parámetros en XGBoost") %>%
    column_spec(2, width = "3.2cm") %>%
    row_spec(0, font_size = 14) %>%
column_spec(1, monospace = T, width = "4.2cm")| parameter | label | Description |
|---|---|---|
| nrounds | # Boosting Iterations | El número total de árboles para emplear |
| max_depth | Max Tree Depth | Se utiliza para controlar el sobreajuste ya que un valor mayor permitirá que el modelo aprenda relaciones muy específicas para una muestra particular. |
| eta | Shrinkage | Hace el modelo más robusto reduciendo los pesos en cada paso. |
| gamma | Minimum Loss Reduction | Controla si utiliza o no una fracción de las observaciones de entrenamiento disponibles. |
| colsample_bytree | Subsample Ratio of Columns | Gamma especifica la reducción positiva mínima en la loss función requerida para hacer una división del nodo. |
| min_child_weight | Minimum Sum of Instance Weight | Denota las columnas a remuestrar para cada árbol. |
| subsample | Subsample Percentage | Define la suma mínima de pesos de todas las observaciones requeridas en un child node. Por valores superiores impiden que un modelo aprenda relaciones que podrían ser muy específicas. |
registerDoParallel(makeCluster(3) -> cpu)
xgbm_results <- train(factor(attrition) ~ ., data = upTrain, verbose = FALSE, method = "xgbTree",
    trControl = control, tuneGrid = expand.grid(min_child_weight = c(5, 30, 50),
        eta = c(0.1, 0.05, 0.01), nrounds = c(500, 1000, 5000, 10000), max_depth = 6,
        gamma = 0, colsample_bytree = 1, subsample = 1))
stopCluster(cpu)
Para caret, estos son los parametros mejores:
r > Best Hyperparameters Tuning:r > [1] "List of 7" " |-nrounds : num 1000"
r > [3] " |-max_depth : num 6" " |-eta : num 0.05"
r > [5] " |-gamma : num 0" " |-colsample_bytree: num 1"
r > [7] " |-min_child_weight: num 5" " |-subsample : num 1"Por supuesto, esta maquina nos devuelve como mejores los parámetros que maximizan la accuracy, no obstante hay que tener en cuenta la estabilidad del modelo a la hora de ajustar. Por esta razón siempre hace falta ver el andamiento del entrenamiento:
plot(xgbm_results, output = "ggplot", "line", layout = c(3, 1), par.settings = list(superpose.line = list(lwd = 1,
    col = c("#2A788E", "#2E45B8", "#440154")), superpose.symbol = list(pch = 19,
    cex = 0.6, col = c("#2A788E", "#2E45B8", "#440154")), strip.background = list(col = "#D6DBF5")))
A partir de este gráfico he decidido de quedarme con min_child_weight=35, en cuanto encuentra el compromiso mejor para estos ajustes.
4.7.2 Modelo final
xgbm <- train(factor(attrition) ~ ., data = upTrain, method = "xgbTree", trControl = control,
    tuneGrid = expand.grid(eta = c(0.05), min_child_weight = c(35), nrounds = c(10000),
        gamma = c(0), subsample = c(1), max_depth = c(6), colsample_bytree = c(1)),
    verbose = FALSE)
4.7.2.1 Matriz de Confusión y Importancia de Variables
draw_confusion_matrix(confusionMatrix(xgbm$pred$pred, xgbm$pred$obs), "#D6DBF5",
    "#2E45B8")


as_tibble(vip::vi(xgbm)) %>%
    filter(Importance > 20) %>%
    mutate(Variable = stringr::str_to_title(Variable)) %>%
    mutate(Variable = str_replace_all(Variable, "_", " ")) %>%
    ggplot(aes(x = reorder(Variable, Importance), y = Importance)) + ggchicklet::geom_chicklet(aes(fill = Importance),
    radius = grid::unit(6, "pt"), width = 0.8, show.legend = F) + labs(x = NULL,
    title = "Variable Importance Plot XGBM") + scale_y_continuous(position = "right") +
    scale_fill_gradient(low = "#D6DBF5", high = "#2E45B8") + coord_flip() + hrbrthemes::theme_ipsum(base_family = "Times",
    grid = "X") + theme(plot.title = element_text(vjust = -1), plot.margin = unit(c(0,
    1, 1, 0.5), "cm"))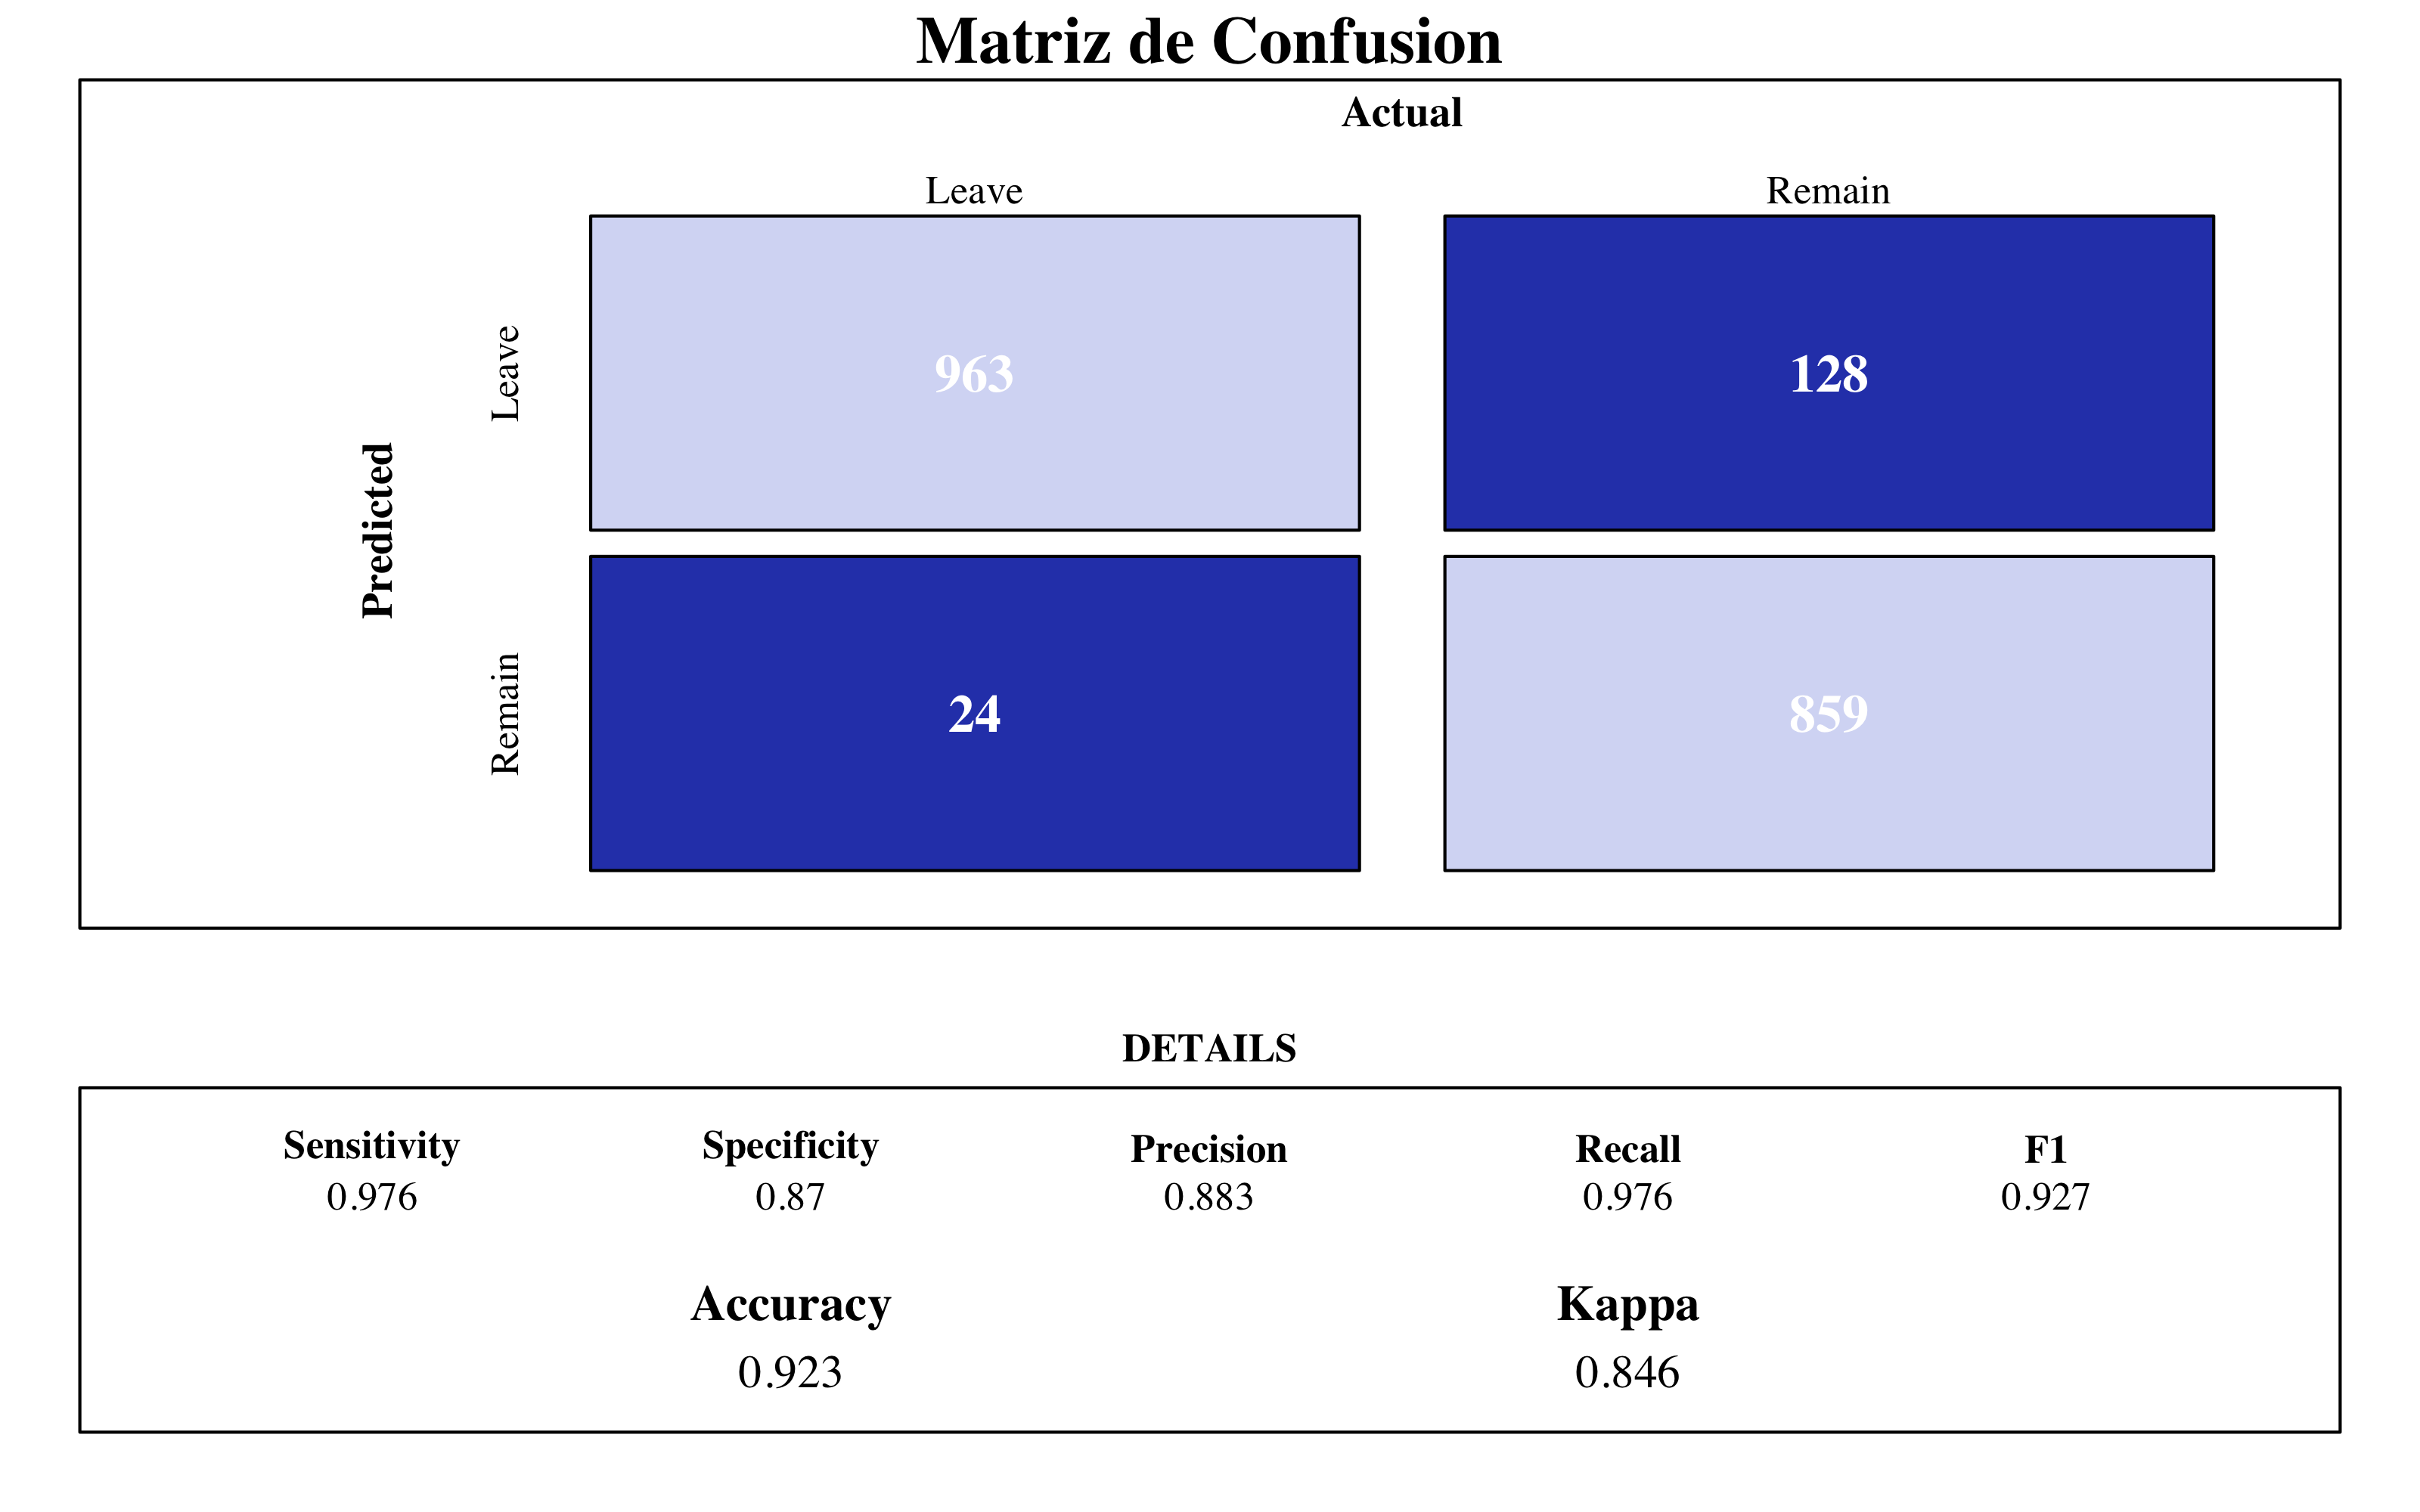
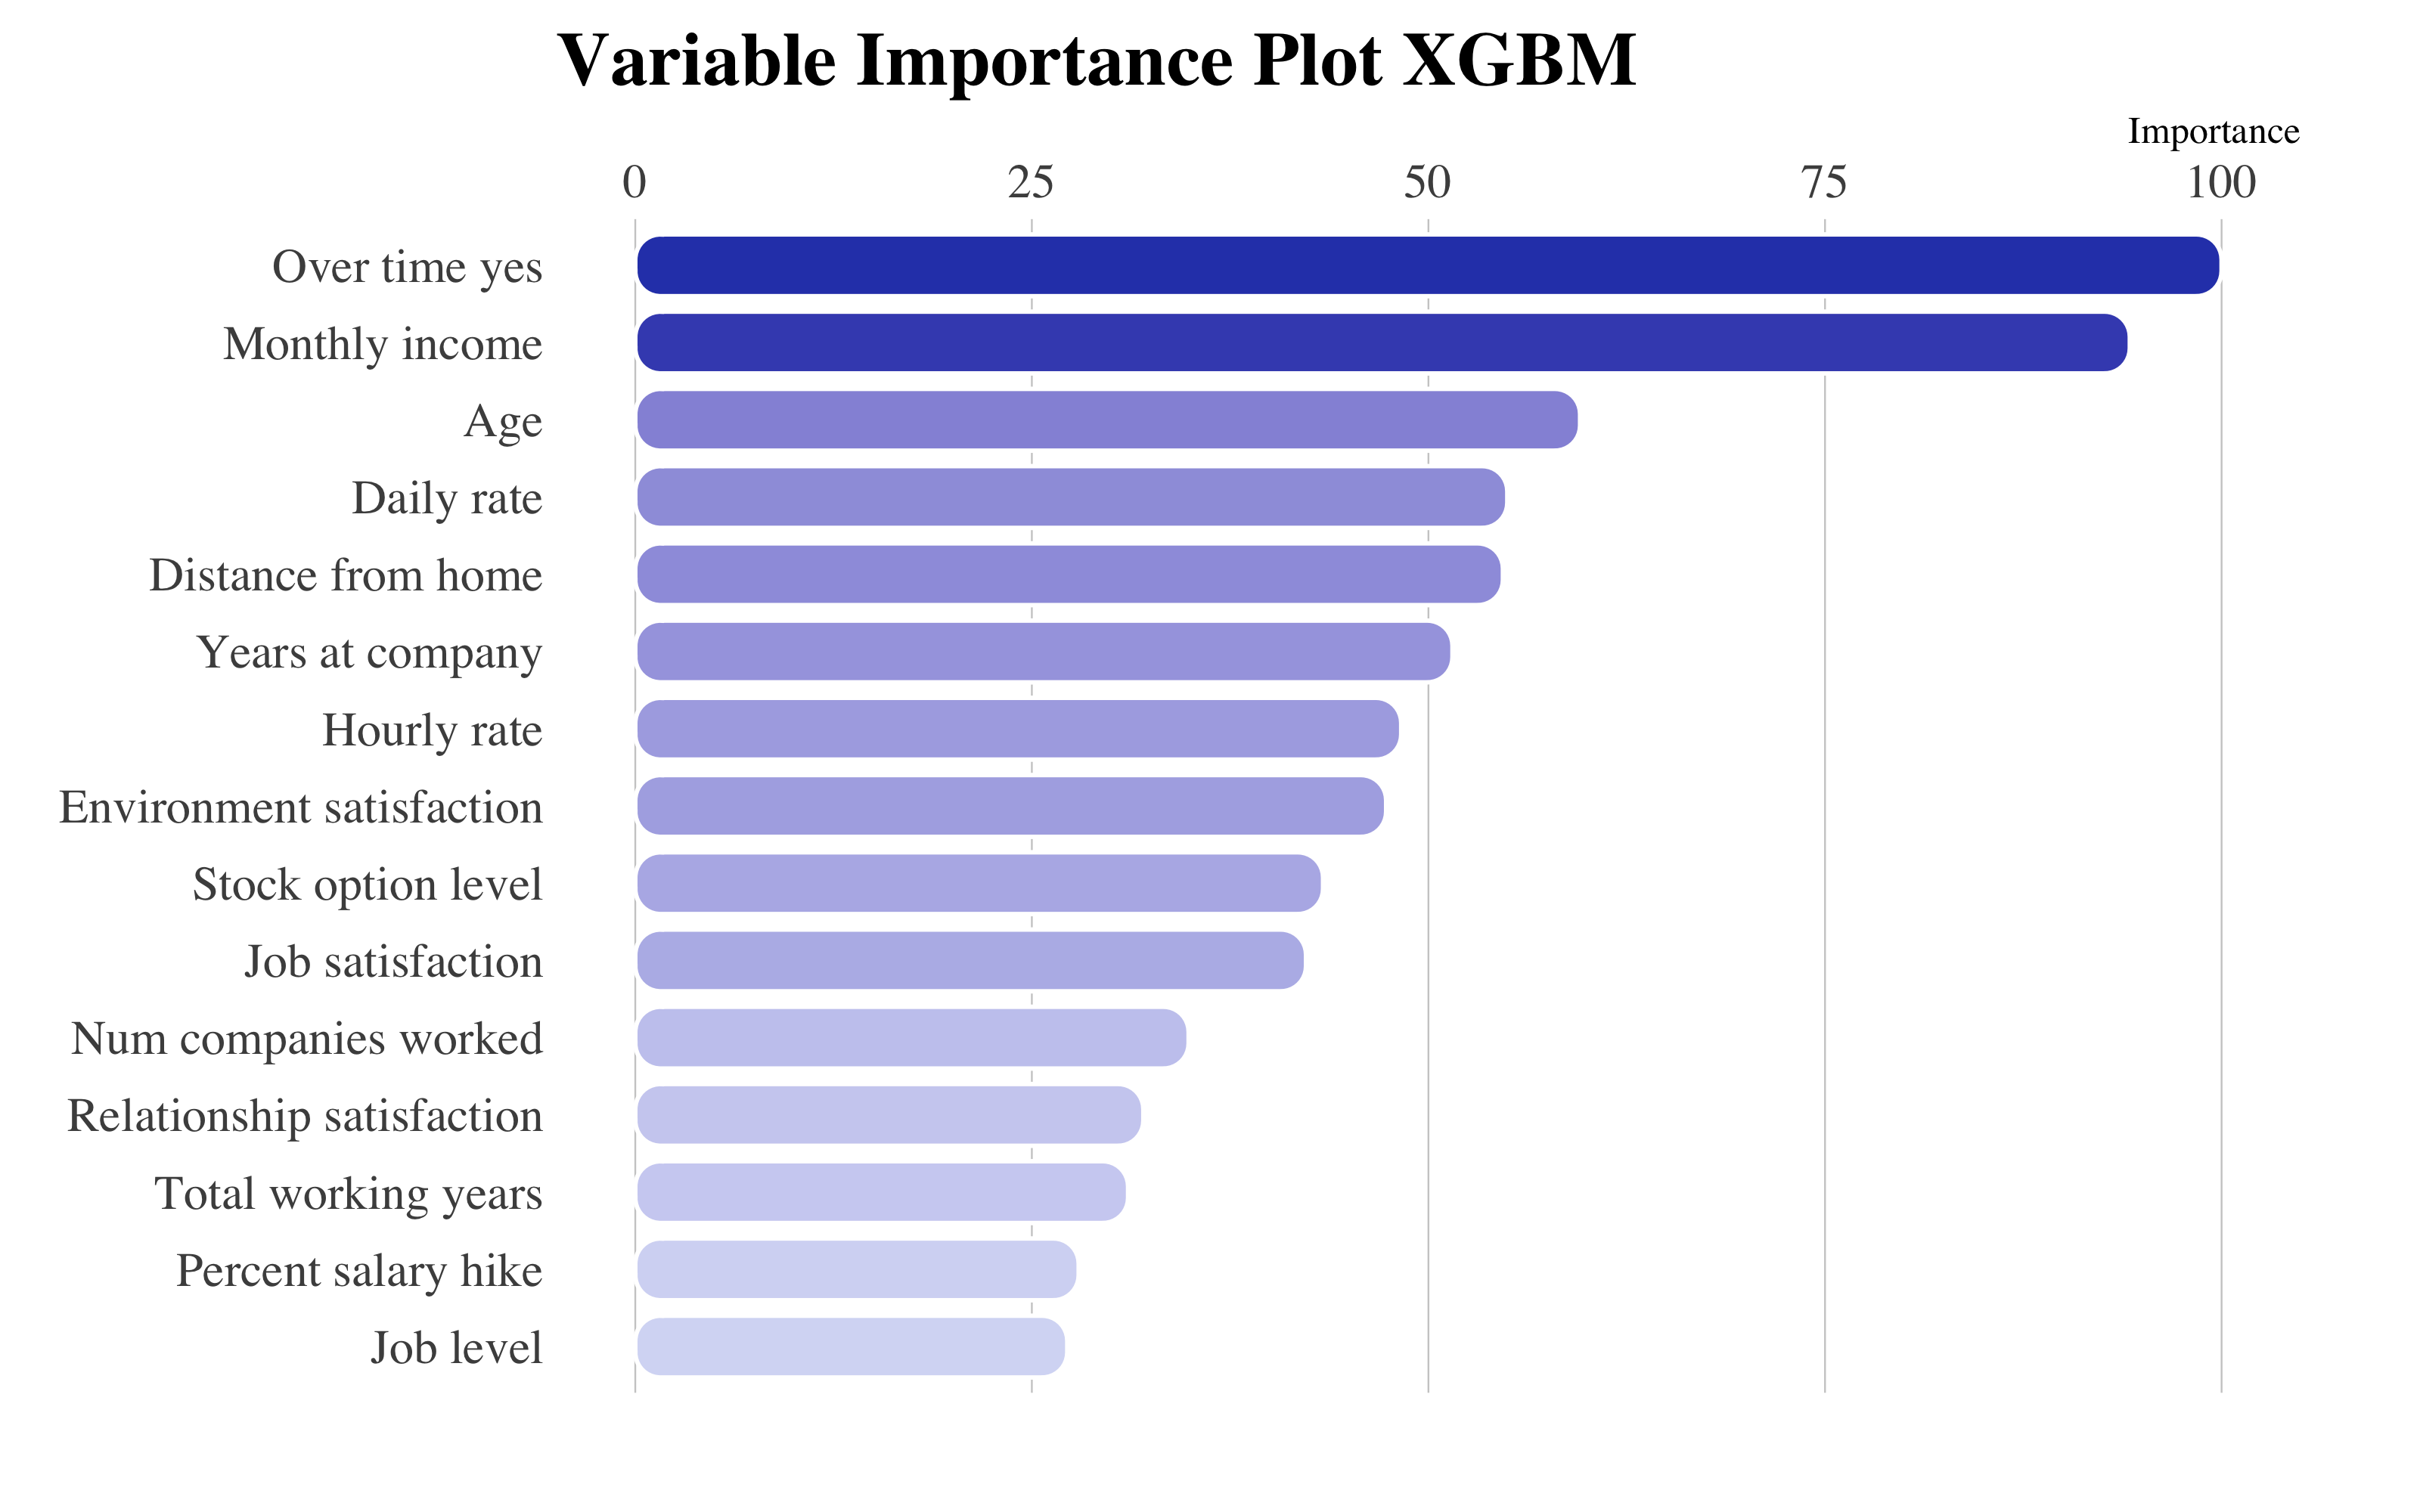
XGBM Final Model
Aquí las variables más importantes son muy parecidas a las del GBM.
Consideraciones
En seguida, este gráfico de cajas y bigotes compara los modelos empleados hasta ahora, con los parametros mejores según cada tuneado. Para ello, en este caso, haré validación cruzada repetida. La métrica que he elegido para la comparación es la área abajo de la curva ROC (AUC).
Arbol <- cruzadaarbolbin(data = upTrain, vardep = "attrition", listconti = predictors,
    listclass = c(""), grupos = 5, sinicio = 112, repe = 5, cp = c(0), minbucket = 105)
Arbol$modelo = "Arbol"

Bagging <- cruzadarfbin(data = upTrain, vardep = "attrition", listconti = predictors,
    listclass = c(""), grupos = 5, sinicio = 112, repe = 5, nodesize = 40, sampsize = 1570,
    mtry = 51, ntree = 1000, replace = TRUE)  #49 min
Bagging$modelo = "Bagging Tree"

RandomForest <- cruzadarfbin(data = upTrain, vardep = "attrition", listconti = predictors,
    listclass = c(""), grupos = 5, sinicio = 112, repe = 5, nodesize = 20, sampsize = 1570,
    mtry = 45, ntree = 2000, replace = TRUE)
RandomForest$modelo = "Random Forest"

GradientBoosting <- cruzadagbmbin(data = upTrain, vardep = "attrition", listconti = predictors,
    listclass = c(""), grupos = 5, sinicio = 112, repe = 5, n.minobsinnode = 35,
    shrinkage = 1, n.trees = 10000, interaction.depth = 2)
GradientBoosting$modelo = "GBM"

XGBoost <- cruzadaxgbmbin(data = upTrain, vardep = "attrition", listconti = predictors,
    listclass = c(""), grupos = 5, sinicio = 1234, repe = 5, min_child_weight = 35,
    eta = 0.05, nrounds = 10000, max_depth = 6, gamma = 0, colsample_bytree = 1,
    subsample = 1)
XGBoost$modelo = "XGBoost"
best_model <- rbind(Logistica, Arbol, Bagging, RandomForest, GradientBoosting, XGBoost)
ggplot(data = best_model, aes(x = factor(modelo, levels = c("Logistica", "Arbol",
"Bagging", "Random Forest", "GBM", "XGBoost")), auc)) + geom_econodist(width = 0.8,
tenth_col = "#879DDD", median_col = "#1D2F65", median_point_size = 1.3, ninetieth_col = "#2E45B8") +
hrbrthemes::theme_ipsum(grid = "XY", base_family = "Times", base_size = 10) +
scale_y_continuous(limits = c(0.85, 1)) + labs(title = "Comparación entre técnicas de árboles",
subtitle = "Area abajo de la curva ROC", y = "AUC", x = NULL) + theme(title = element_text(face = "bold"),
axis.title.y = element_text(size = 10), axis.text.x = element_text(face = "bold",
colour = "#3D3D3D", size = 10)) + theme_econodist(econ_text_col = "#3b454a",
econ_plot_bg_col = "white", econ_grid_col = "#bbcad2", econ_font = "Times", light_font = "Times",
bold_font = "Times") + theme(plot.title = element_text(face = "bold")) ->
gg
grid.newpage()
left_align(gg, c("subtitle", "title", "caption")) %>%
add_econodist_legend(econodist_legend_grob(family = "Times", tenth_col = "#879DDD",
med_col = "#1D2F65", ninetieth_col = "#1D2F65"), below = "subtitle") %>%
grid.draw()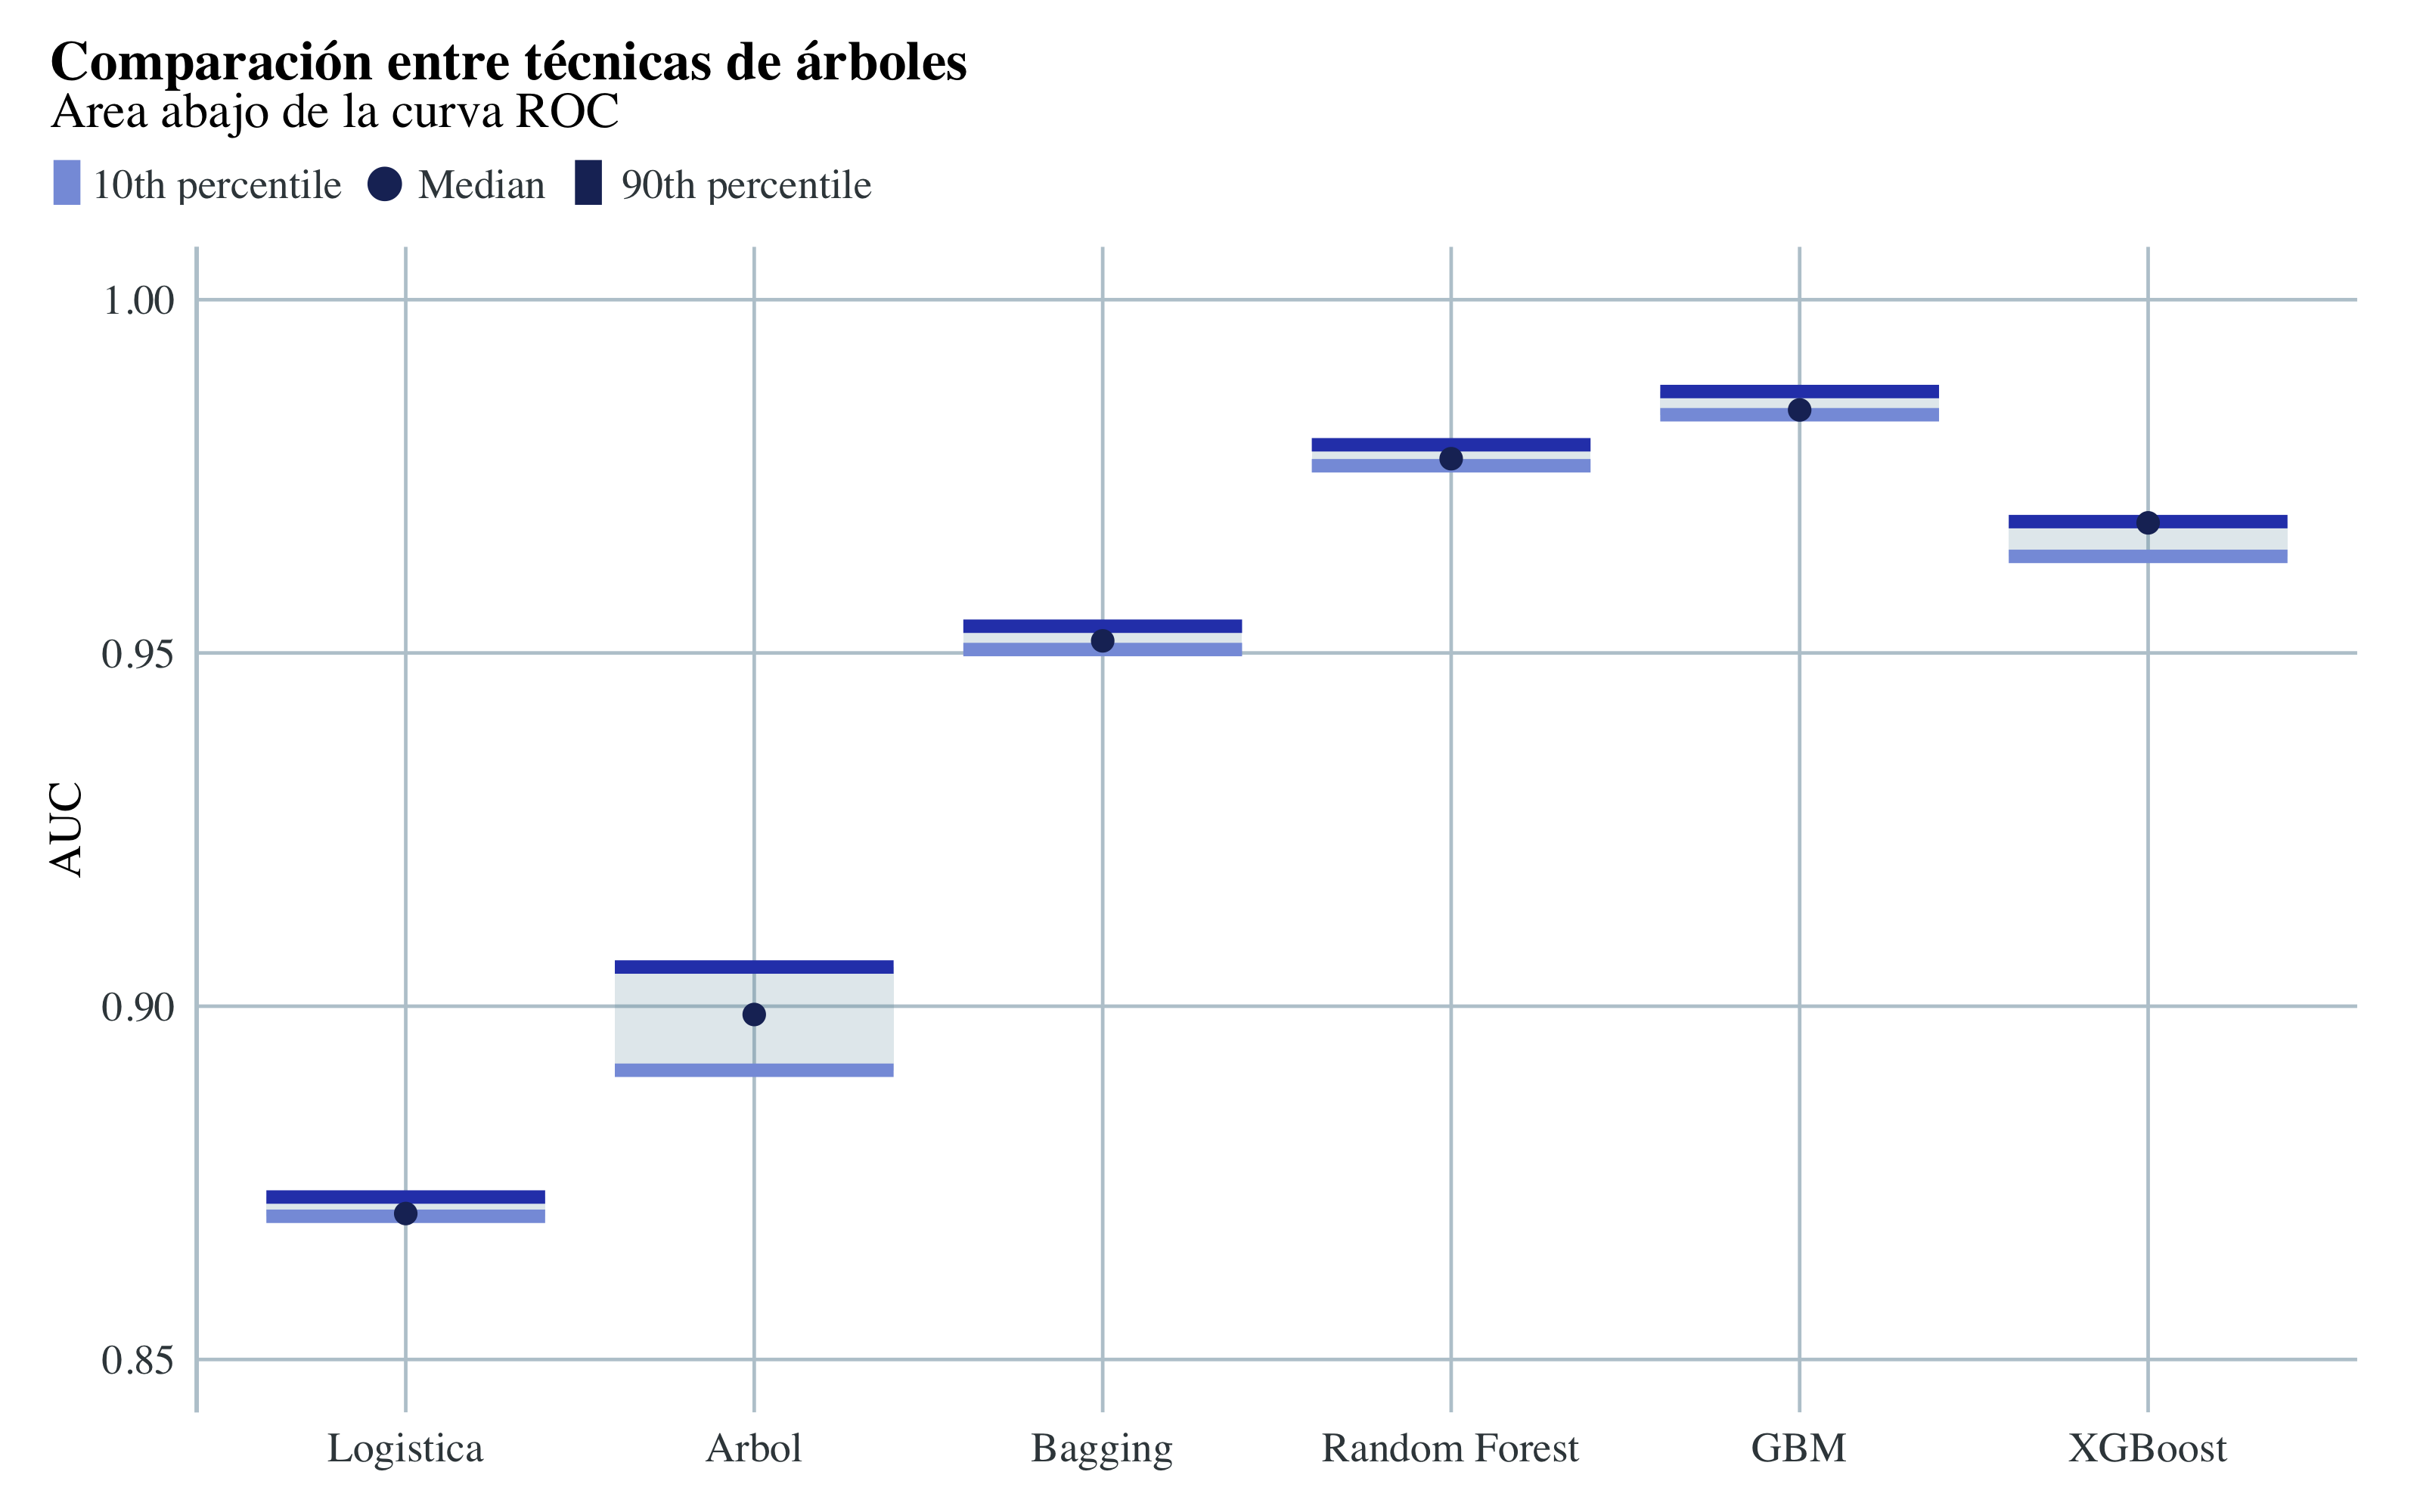
Comparación AUC entre modelos
- Todos los métodos ensemble tienen las mejores métricas, y aportan mejores ajustes al árbol solo y a la regresion logistica.
- El modelo ganador es el Gradient Boosting, aunque el Random Forest, y el XGboost están justo abajo.
ggplot(data = best_model %>%
    filter(modelo %in% c("Bagging", "Random Forest", "GBM", "XGBoost")), aes(x = factor(modelo,
    levels = c("Bagging", "Random Forest", "GBM", "XGBoost")), as.numeric(tasa))) +
    geom_econodist(width = 0.8, tenth_col = "#879DDD", median_col = "#1D2F65", median_point_size = 1.3,
        ninetieth_col = "#2E45B8") + hrbrthemes::theme_ipsum(grid = "XY", base_family = "Times",
    base_size = 10) + labs(title = "Comparación entre técnicas de árboles", subtitle = "Tasa de fallo",
    y = "AUC", x = NULL) + theme(title = element_text(face = "bold"), axis.title.y = element_text(size = 10),
    axis.text.x = element_text(face = "bold", colour = "#3D3D3D", size = 10)) + theme_econodist(econ_text_col = "#3b454a",
    econ_plot_bg_col = "white", econ_grid_col = "#bbcad2", econ_font = "Times", light_font = "Times",
    bold_font = "Times") + theme(plot.title = element_text(face = "bold")) ->
    gg

grid.newpage()
left_align(gg, c("subtitle", "title", "caption")) %>%
    add_econodist_legend(econodist_legend_grob(family = "Times", tenth_col = "#879DDD",
        med_col = "#1D2F65", ninetieth_col = "#1D2F65"), below = "subtitle") %>%
    grid.draw()

ggplot(data = best_model %>%
    filter(modelo %in% c("Bagging", "Random Forest", "GBM", "XGBoost")), aes(x = factor(modelo,
    levels = c("Bagging", "Random Forest", "GBM", "XGBoost")), auc)) + geom_econodist(width = 0.8,
    tenth_col = "#879DDD", median_col = "#1D2F65", median_point_size = 1.3, ninetieth_col = "#2E45B8") +
    hrbrthemes::theme_ipsum(grid = "XY", base_family = "Times", base_size = 10) +
    labs(title = "Comparación entre técnicas de árboles", subtitle = "Area abajo de la curva ROC",
        y = "AUC", x = NULL) + theme(title = element_text(face = "bold"), axis.title.y = element_text(size = 10),
    axis.text.x = element_text(face = "bold", colour = "#3D3D3D", size = 10)) + theme_econodist(econ_text_col = "#3b454a",
    econ_plot_bg_col = "white", econ_grid_col = "#bbcad2", econ_font = "Times", light_font = "Times",
    bold_font = "Times") + theme(plot.title = element_text(face = "bold")) ->
    gg

grid.newpage()
left_align(gg, c("subtitle", "title", "caption")) %>%
    add_econodist_legend(econodist_legend_grob(family = "Times", tenth_col = "#879DDD",
        med_col = "#1D2F65", ninetieth_col = "#1D2F65"), below = "subtitle") %>%
    grid.draw()

Mejores modelos
Con este gráfico podemos ver mejor los resultados de las iteracciones de los modelos planteados. El modelo de gradient boosting tiene un AUC de casi 0.99, con una tasa de fallo alrededor de 0.04.
Luego, para observar hasta que punto la variación del modelo influye sobre la importancia de las variables, he creado un gráfico de barras apiladas, puesto a ordenar las variables según importancia total de los modelos juntos.
library(ggchicklet)
library(vip)
inner_join(vi(xgbm), vi(gbm), by = "Variable") %>%
    inner_join(vi(rf), by = "Variable") %>%
    inner_join(vi(bg), by = "Variable") %>%
#   inner_join(vi(arbol), by= "Variable") %>%
    rename(
        "XGBM" = Importance.x,
        "GBM" = Importance.y,
        "Random Forest" = Importance.x.x,
        "Bagging" = Importance.y.y,
#       "Tree" = Importance
    ) %>%
    mutate(
        Variable = stringr::str_to_title(Variable)) %>%
    mutate(Variable = str_replace_all(Variable, "_", " ")) %>%
    pivot_longer(!Variable,
                             names_to = "Model",
                             values_to = "Importance") %>%
    arrange(desc(Importance)) %>%
    ggplot(aes(reorder(Variable, Importance),
                         Importance,
                         group = Model,
                         fill = Model)) +
    geom_chicklet(width = 0.8,
                                radius = grid::unit(6, "pt")) +
    scale_y_continuous(position = "right",
                                         breaks = seq(0,300, by = 50)) +
    scale_fill_manual(
        name = NULL,
        values = c(
#           "Tree" = "#D6DBF5",
            "Bagging" = "#B0B9E7",
            "Random Forest" = "#8B98D9",
            "GBM" = "#6576CB",
            "XGBM" = "#4055BE"
        )
    ) +
    guides(fill = guide_legend(nrow = 1)) +
    coord_flip() +
    labs(
        x = NULL,
        y = NULL,
        fill = NULL,
        title = "Importancia variables según cada modelo ",
        subtitle = "",
        caption = "El árbol de decision no ha sido considerado en cuanto no todas las variables entran en el modelo"
    ) +
    hrbrthemes::theme_ipsum(base_family = "Times",
                                                    grid = "Xx",
                                                    base_size = 12) +
    theme(
        plot.title = element_text(vjust = -1),
        legend.text = element_text(size=12),
        plot.margin = unit(c(0, 1, 1, 0.5), "cm"),
        legend.position = "top",
    )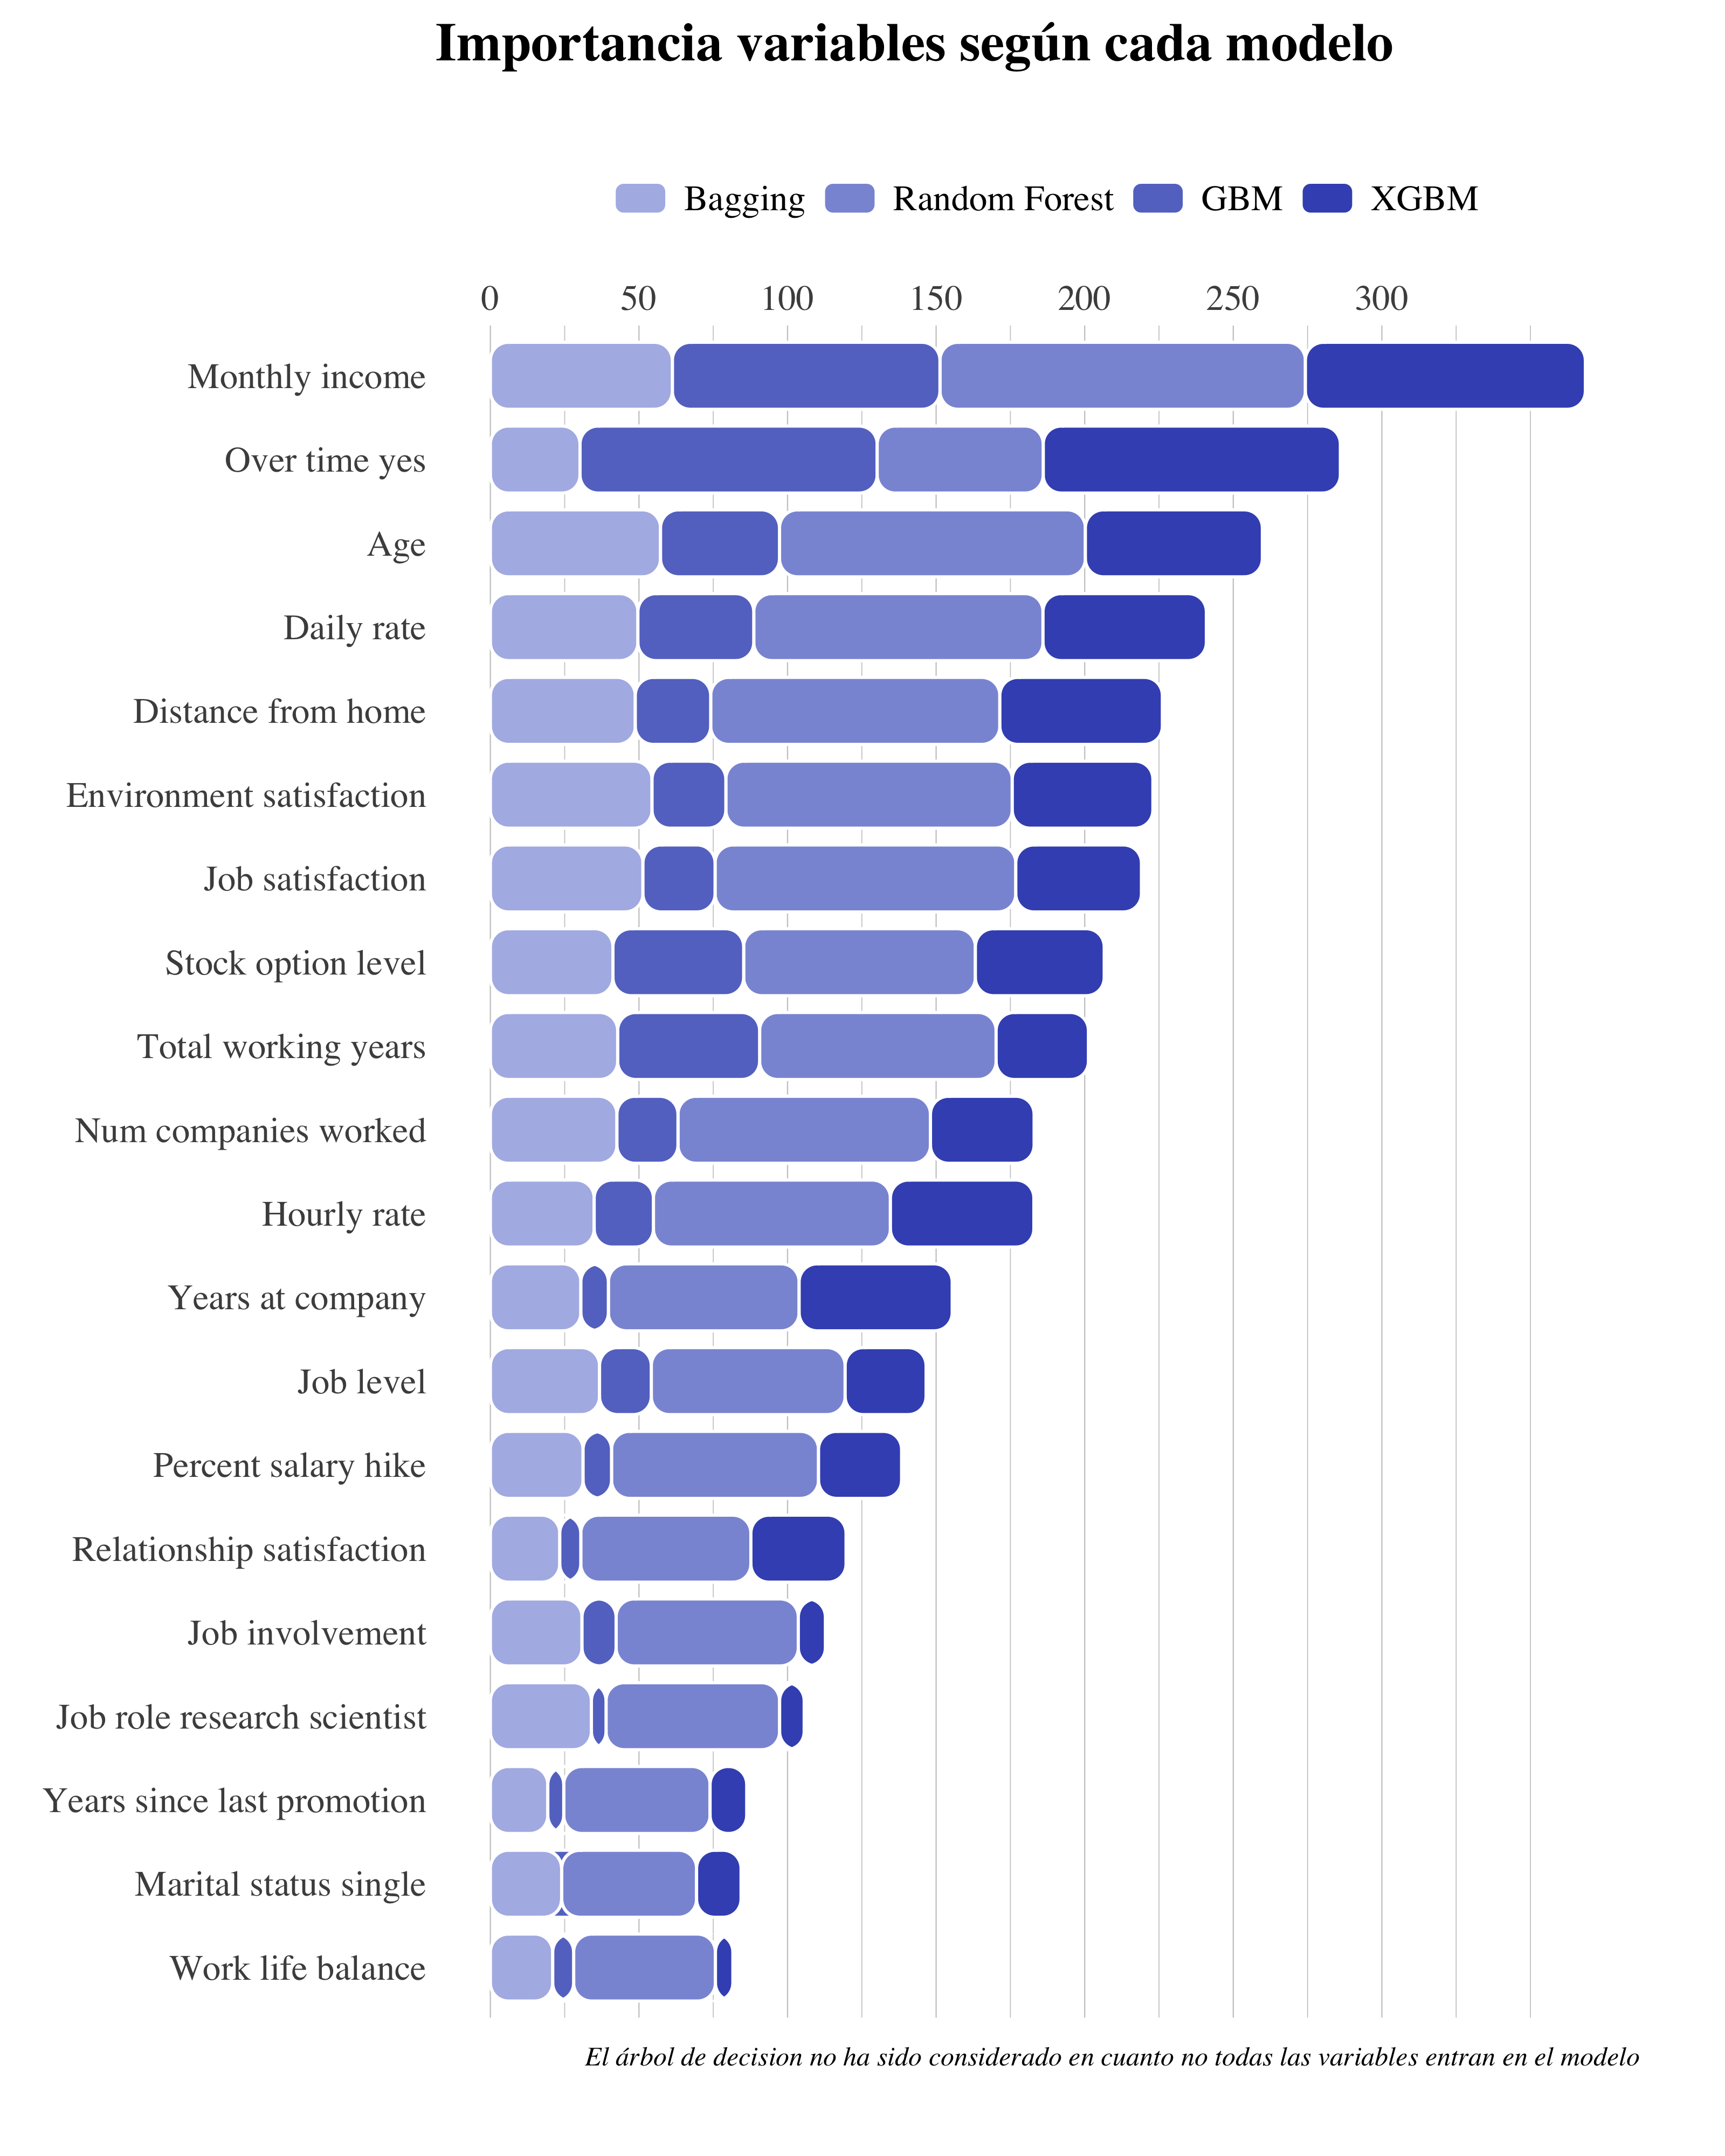
- Podemos observar como las variable más influyentes son MonthlyIcome y OverTime_Yes, es decir las cosas cosas que influyen más los empleados a la hora de dejar una empresa son el salario mensual y si trabajan de sobra a las horas estandard.
- La edad y los años pasados a trabajar en la empresa también son importantes. Esto es normal en cuanto hay que tener en cuenta también los que van por el jubilado.
- Otro conjunto de variables que destacan sus influencia son las que miden el nivel de satisfacción general, es decir EnvironmentSatisfaction, JobSatisfaction y RelationshipSatisfaction.
Porque este gráfico es muy importante? Porque a partir de ahora, voy a emplear otras técnicas de machine learning a partir de este conjunto de variables más influyentes a la hora de medir el índice de deserción de los empleados. Seguímos.
Nuevo conjunto Train/Test con variables más influyentes
upTrain2 <- upTrain %>%
    select("attrition", "monthly_income", "over_time_yes", "age", "daily_rate", "environment_satisfaction",
        "distance_from_home", "job_satisfaction", "stock_option_level", "total_working_years",
        "num_companies_worked", "hourly_rate", "years_at_company", "percent_salary_hike",
        "relationship_satisfaction", "job_level", "job_involvement", "job_role_research_scientist",
        "years_since_last_promotion", "marital_status_single", "work_life_balance")

Test2 <- Test %>%
    select("attrition", "monthly_income", "over_time_yes", "age", "daily_rate", "environment_satisfaction",
        "distance_from_home", "job_satisfaction", "stock_option_level", "total_working_years",
        "num_companies_worked", "hourly_rate", "years_at_company", "percent_salary_hike",
        "relationship_satisfaction", "job_level", "job_involvement", "job_role_research_scientist",
        "years_since_last_promotion", "marital_status_single", "work_life_balance")
4.8 Support Vector Machines
4.8.1 SVM Lineal
Como hemos podido ver a partir de la EDA, no hay separacíon lineal entre los datos. Entonces, podemos ya decir que entre los SVM que voy a emplear, los con un kernel linel no van a funcionar bien con estos datos.
4.8.1.1 Tuneo del Modelo
registerDoParallel(makeCluster(3) -> cpu)
tic()
set.seed(112)  # for reproducibility
svm_lin_result <- train(factor(attrition) ~ ., data = upTrain2, method = "svmLinear",
    verbose = FALSE, trControl = control, tuneGrid = expand.grid(C = c(0.01, 0.05,
        0.1, 0.2, 0.5, 1, 2, 5, 10, 20, 50)), )
toc()  #5.84min (15.1 min con todas las variables)
stopCluster(cpu)
Visualizamos los resultados del tuneo:
cbind(svm_lin_result$bestTune, getTrainPerf(svm_lin)) %>%
kable(format = "html", bootstrap_options = "basic", caption = "Best Tune", digits = 3)| C | TrainAccuracy | TrainKappa | method |
|---|---|---|---|
| 0.01 | 0.771 | 0.542 | svmLinear |
ggplot(svm_lin_result) + geom_line(colour = "#2E45B8", size = 0.8) + geom_point(colour = "#5670C0") +
    hrbrthemes::theme_ipsum(ticks = T, base_family = "Times", base_size = 12) + labs(title = "Tuning Results",
    subtitle = "SVM Lineal") + theme(legend.position = "none", panel.background = element_rect(color = "#3b454a"),
    title = element_text(face = "bold"), axis.title.y = element_text(size = 12),
    axis.title.x = element_text(colour = "#3D3D3D", size = 12))
4.8.1.2 Modelo Final
svm_lin <- train(factor(attrition) ~ ., data = upTrain2, method = "svmLinear", verbose = FALSE,
trControl = control, tuneGrid = expand.grid(C = c(0.01)))draw_confusion_matrix(confusionMatrix(svm_lin$pred$pred, svm_lin$pred$obs), "#D6DBF5",
"#2E45B8")
roc(svm_lin$pred$obs, svm_lin$pred$Yes) %>%
ggroc(colour = "#2E45B8", size = 0.8) + annotate("text", x = 0.08, y = 0.88,
label = "bold(AUC): 0.827", family = "Times", parse = TRUE) + hrbrthemes::theme_ipsum(ticks = T,
base_family = "Times", base_size = 12) + labs(title = "ROC Curve", subtitle = "SVM Lineal") +
theme(legend.position = "none", panel.background = element_rect(color = "#3b454a"),
title = element_text(face = "bold"), axis.title.y = element_text(size = 12),
axis.title.x = element_text(colour = "#3D3D3D", size = 12))

SVM Lineal
Entre los modelos empleados hasta ahora, no aporta buenas métricas. Vamos a construir una maquina de suporte vectorial con un kernel más complejo.
4.8.2 SVM Polinomial
library(kableExtra)
modelLookup("svmPoly")[2:3] %>%
    cbind(description = linebreak(c("El grado de la fúncion polinomial", "El parametro que ajusta el kernel a la hora de dividir las predicciones",
        "El parámetro de regularización (C), la constante C del término de regularización en la formulación de Lagrange, indica a la maquina de suporte cuánto evitar la clasificación errónea de cada ejemplo de entrenamiento."))) %>%
    kable(format = "html", align = c(rep("l", 3)), caption = "Descripcion de los parámetros en SVM Polinomial") %>%
    row_spec(0, font_size = 14) %>%
    column_spec(1, width = 12, monospace = T) %>%
column_spec(2, width = 14)| parameter | label | description |
|---|---|---|
| degree | Polynomial Degree | El grado de la fúncion polinomial |
| scale | Scale | El parametro que ajusta el kernel a la hora de dividir las predicciones |
| C | Cost | El parámetro de regularización (C), la constante C del término de regularización en la formulación de Lagrange, indica a la maquina de suporte cuánto evitar la clasificación errónea de cada ejemplo de entrenamiento. |
4.8.2.1 Tuneo del Modelo
registerDoParallel(makeCluster(3) -> cpu)
tic()
set.seed(112)  # for reproducibility
svm_poly_result <- train(factor(attrition) ~ ., data = upTrain2, method = "svmPoly",
    verbose = FALSE, trainControl = control, tuneGrid = expand.grid(C = c(0.01, 0.05,
        0.1, 0.2, 1), degree = c(2, 3), scale = c(0.1, 0.5, 1, 2)))
toc()  #18.45 min
stopCluster(cpu)
Esta tabla nos dice cual han sido los parámetros mejores:
cbind(svm_poly_result$bestTune, getTrainPerf(svm_poly)) %>%
kable(format = "html", bootstrap_options = "basic", caption = "Best Tune", digits = 3)| degree | scale | C | TrainAccuracy | TrainKappa | method | |
|---|---|---|---|---|---|---|
| 8 | 3 | 2 | 0.01 | 0.953 | 0.907 | svmPoly |
plot(svm_poly_result, output = "ggplot", "line", layout = c(2, 1), par.settings = list(superpose.line = list(lwd = 1,
    col = c("#D6DBF5", "#5670C0", "#2E45B8", "#2A788E")), superpose.symbol = list(pch = 19,
    cex = 0.6, col = c("#D6DBF5", "#5670C0", "#2E45B8", "#2A788E")), strip.background = list(col = "#D6DBF5")))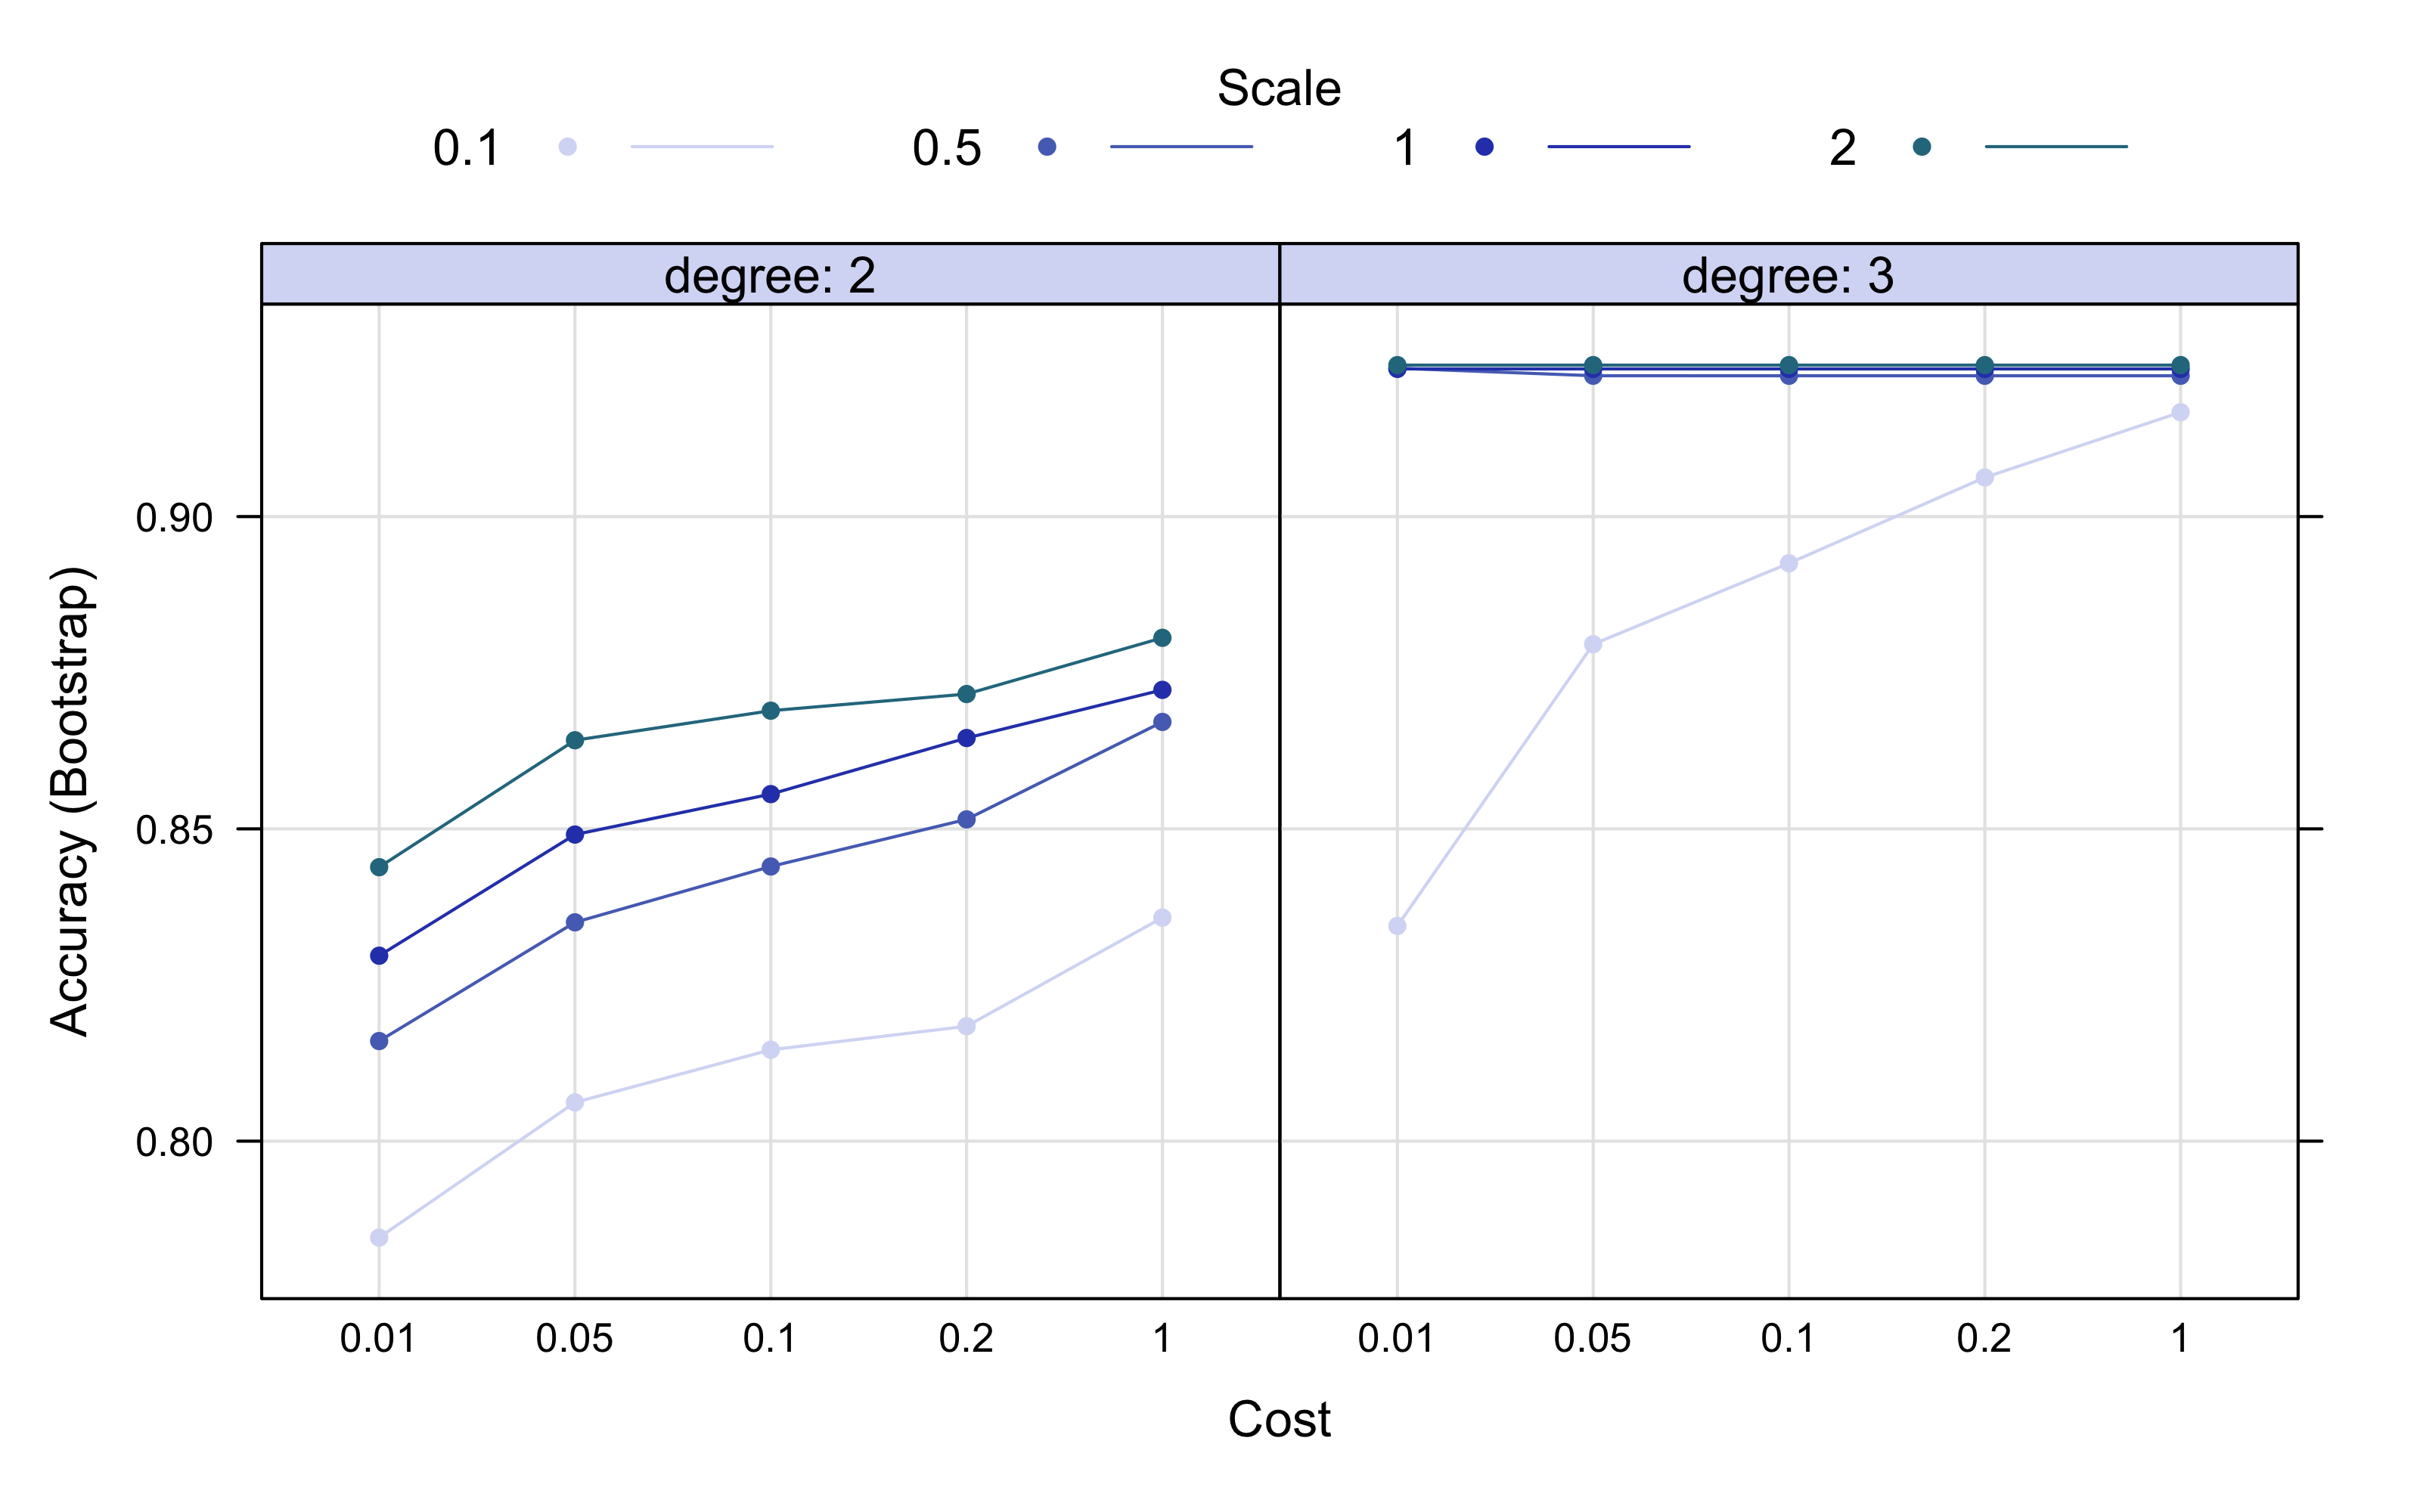
También es importante una constatación visual del tuneo. Podemos ver que la máxima accuracy se alcanza con un grado de 3, mejorando mucho el grado 2. Me parece normal como el conjunto de datos tiene muchas variables. El ajuste del kernel mejor es el 2, aunque con un polinómico de 3 grados es suficiente un valor entre 0.5 y 1
4.8.2.2 Modelo Final
svm_poly <- train(factor(attrition) ~ ., data = upTrain2, method = "svmPoly", verbose = FALSE,
trControl = control, tuneGrid = expand.grid(C = c(0.01), degree = c(3), scale = c(2)))draw_confusion_matrix(confusionMatrix(svm_poly$pred$pred, svm_poly$pred$obs), "#D6DBF5",
"#2E45B8")
roc(svm_poly$pred$obs, svm_poly$pred$Yes) %>%
ggroc(colour = "#2E45B8", size = 0.63) + annotate("text", x = 0.08, y = 0.92,
label = "bold(AUC): 0.97", family = "Times", parse = TRUE) + hrbrthemes::theme_ipsum(ticks = T,
base_family = "Times", base_size = 10) + labs(title = "ROC Curve", subtitle = "SVM Polinomial") +
theme(legend.position = "none", panel.background = element_rect(color = "#3b454a"),
title = element_text(face = "bold"), axis.title.y = element_text(size = 10),
axis.text.x = element_text(face = "bold", colour = "#3D3D3D", size = 10))

SVM Polinomial
La maquina de suporte vectorial con kernel polinómico mejora mucho la con kernel lineal. Con un accuracy de 0.95 y AUC de 0.97 es uno de los mejores modelos ajustados hasta ahora.
4.8.3 SVM Radial
Vamos a ajustar la última de las maquinas de suporte vectorial. Esta vez, entre los parámetros a tunear, encontramos como siempre el parámetro de regularización y sigma, que determina el alcance de una sola instancia de entrenamiento.
4.8.3.1 Tuneo del Modelo
registerDoParallel(makeCluster(3) -> cpu)
tic()
set.seed(112)  # for reproducibility
svm_rad_result <- train(factor(attrition) ~ ., data = upTrain2, method = "svmRadial",
    verbose = FALSE, trainControl = control, tuneGrid = expand.grid(C = c(0.01, 0.05,
        0.1, 0.2, 0.5, 1, 2, 5, 10, 30), sigma = c(0.01, 0.05, 0.1, 0.2, 0.5, 1,
        2, 5, 10, 30)), )
toc()  #10.71 min
stopCluster(cpu)
Estos son los parámetros mejores:
cbind(svm_rad_result$bestTune, getTrainPerf(svm_rad_result)) %>%
kable(format = "html", bootstrap_options = "basic", caption = "Best Tune", digits = 3)| sigma | C | TrainAccuracy | TrainKappa | method | |
|---|---|---|---|---|---|
| 60 | 30 | 1 | 0.985 | 0.97 | svmRadial |
Ahora vemos como ha mejorado el tuneo dependiendo del valor de su sigma.
ggplot(subset(svm_rad_result$results), aes(x = sigma, y = Accuracy, col = factor(C))) +
    facet_wrap(C ~ ., ncol = 3) + xlab("Sigma") + guides(col = guide_legend(title = "C")) +
    scale_color_brewer(palette = "Paired") + geom_step() + geom_point(size = 0.8,
    shape = 3) + theme_minimal(base_family = "Times")
Se puede observar como a partir de un coste de regularización igual a 1, la maxima accuracy se puede alcanzar con un valor de sigma entre 2 y 5.
4.8.3.2 Modelo Final
set.seed(112)  # for reproducibility
svm_rad <- train(factor(attrition) ~ ., data = upTrain2, method = "svmRadial", verbose = FALSE,
trControl = control, tuneGrid = expand.grid(C = c(30), sigma = c(1)))draw_confusion_matrix(confusionMatrix(svm_rad$pred$pred, svm_rad$pred$obs), "#D6DBF5",
"#2E45B8")
roc(svm_rad$pred$obs, svm_rad$pred$Yes) %>%
ggroc(colour = "#2E45B8", size = 0.5) + annotate("text", x = 0.08, y = 0.75,
label = "bold(AUC): 0.998", family = "Times", parse = TRUE) + hrbrthemes::theme_ipsum(ticks = T,
base_family = "Times", base_size = 10) + labs(title = "ROC Curve", subtitle = "SVM Radial") +
theme(legend.position = "none", panel.background = element_rect(color = "#3b454a"),
title = element_text(face = "bold"), axis.title.y = element_text(size = 10),
axis.text.x = element_text(face = "bold", colour = "#3D3D3D", size = 10))

SVM Radial
Esta maquina de suporte vectorial con kernel radial alcanza las mejores métricas sobre estos datos:
- Accuracy 0.998
- AUC 0.998
Hay que tener en cuenta siempre que estos datos son ficticios, entonces no ha sido tan difícil encontrar métricas tan alta.
4.9 Bagging SVM
Para emplear el bagging del SVM he construido una función que me ha permitido hacer las computaciones mas rápidas a través de un bucle paralelizado que computa tantas muestras cuantas quiero, ajustando mi mejor modelo SVM lineal identificado antes y que devuelve un vector con las predicciones promediadas a partir de las filas de las distintas predicciones de los modelos sobre cada muestra.
Lo interesante de esta implementación es que puedo controlar cada parámetro de este algoritmo y también puedo sustituir el weak learner (en este caso, es el SVM lineal del paquete e1071) para realizar el bagging con otros modelos. Además la implementación en paralelo permite de realizar el algoritmo rápidamente y no pesa la cache en cuanto solo el vector final con las predicciones está guardado.
library(e1071)
library(doParallel)
library(tictoc)

BaggingSVM_Lin <- function(train, test, samples, size, cost){

registerDoParallel(makeCluster(3) -> cpu)
tic()

predictions <- foreach(
    icount(samples),  #iterazioni
    .packages = "e1071",
    .combine = cbind  #azione da fare per ogni iterazione
#adesso, parallel computing per velocizzare il loop
) %dopar% {
    # bootstrap sample dei dati train
    index <- sample.int(n=nrow(train),
                                         #qui definiamo quante osservazioni ogni sample
                                         size = floor(size*nrow(train)),
                                         replace = TRUE)
    sample <- train[index, ]

    # fit model per il sample
    bagged_svm <- svm(factor(attrition)~.,
                                        data=sample,
                                        kernel ="linear",
                                        probability=TRUE,
                                        # la funzione prende valore 'cost'
                                        cost = cost)

    #calcoliamo adesso le predizioni sul TEST
    as.data.frame(attr(
        predict(bagged_svm,
                        newdata=test,
                        probability=TRUE), "prob"))$Yes
}
toc() #3 sec (4)
stopCluster(cpu)

#Ritorna un vettore con le medie per fila di ogni osservazione
return(rowMeans(predictions))
}
Ahora implemento la función con 1000 submuestras, he realizado varías pruebas con diferentes dimensiones de muestras y este valor debería ser suficiente para establecer el error. El tamaño de cada submuestra es el 60% de los datos iniciales.
Ahora comparamos el modelo final ensemble con el modelo de SVM lineal, a través de la curva ROC.
roc.list <- list(`Bagging SVM` = roc(Test2$attrition, bagging_svm), SVM = roc(svm_lin$pred$obs,
    svm_lin$pred$Yes))


ci.list <- lapply(list(`Bagging SVM` = roc(Test2$attrition, bagging_svm), SVM = roc(svm_lin$pred$obs,
    svm_lin$pred$Yes)), ci.se, specificities = seq(0, 1, l = 25))

dat.ci.list <- lapply(ci.list, function(ciobj) data.frame(x = as.numeric(rownames(ciobj)),
    lower = ciobj[, 1], upper = ciobj[, 3]))
p <- ggroc(roc.list, size = 0.7, alpha = 0.9) + scale_color_manual(name = NULL, values = c(`Bagging SVM` = "#9EA9E0",
SVM = "#2E45B8")) + hrbrthemes::theme_ipsum(ticks = T, base_family = "Times",
base_size = 10) + labs(title = "ROC Curve", subtitle = "Comparing ROC curves for single models and Stacking") +
geom_abline(slope = 1, intercept = 1, linetype = "dashed", alpha = 0.7, color = "grey") +
ylab("Sensitivity") + xlab("Specificity") + annotate("rect", xmin = 0.25, xmax = 0,
ymin = 0, ymax = 0.25, fill = "white") + annotate("text", x = 0.13, y = 0.18,
label = "bold(AUC): 0.81", colour = "#9EA9E0", family = "Times", parse = TRUE) +
annotate("text", x = 0.13, y = 0.08, colour = "#2E45B8", label = "bold(AUC): 0.82",
family = "Times", parse = TRUE) + theme(aspect.ratio = 0.5, plot.margin = unit(c(1,
1, 0.1, 0.1), "cm"), legend.title = element_blank(), legend.text = element_text(size = 12),
legend.position = "top", panel.background = element_rect(color = "#3b454a"),
title = element_text(face = "bold"))
for (i in 1:2) {
if (i == 1) {
col = "#2E45B8"
a = 0.2
} else {
col = "#2E45B8"
a = 0.5
}
p <- p + geom_ribbon(data = dat.ci.list[[i]], aes(x = x, ymin = lower, ymax = upper),
fill = col, alpha = a, inherit.aes = F)
}
p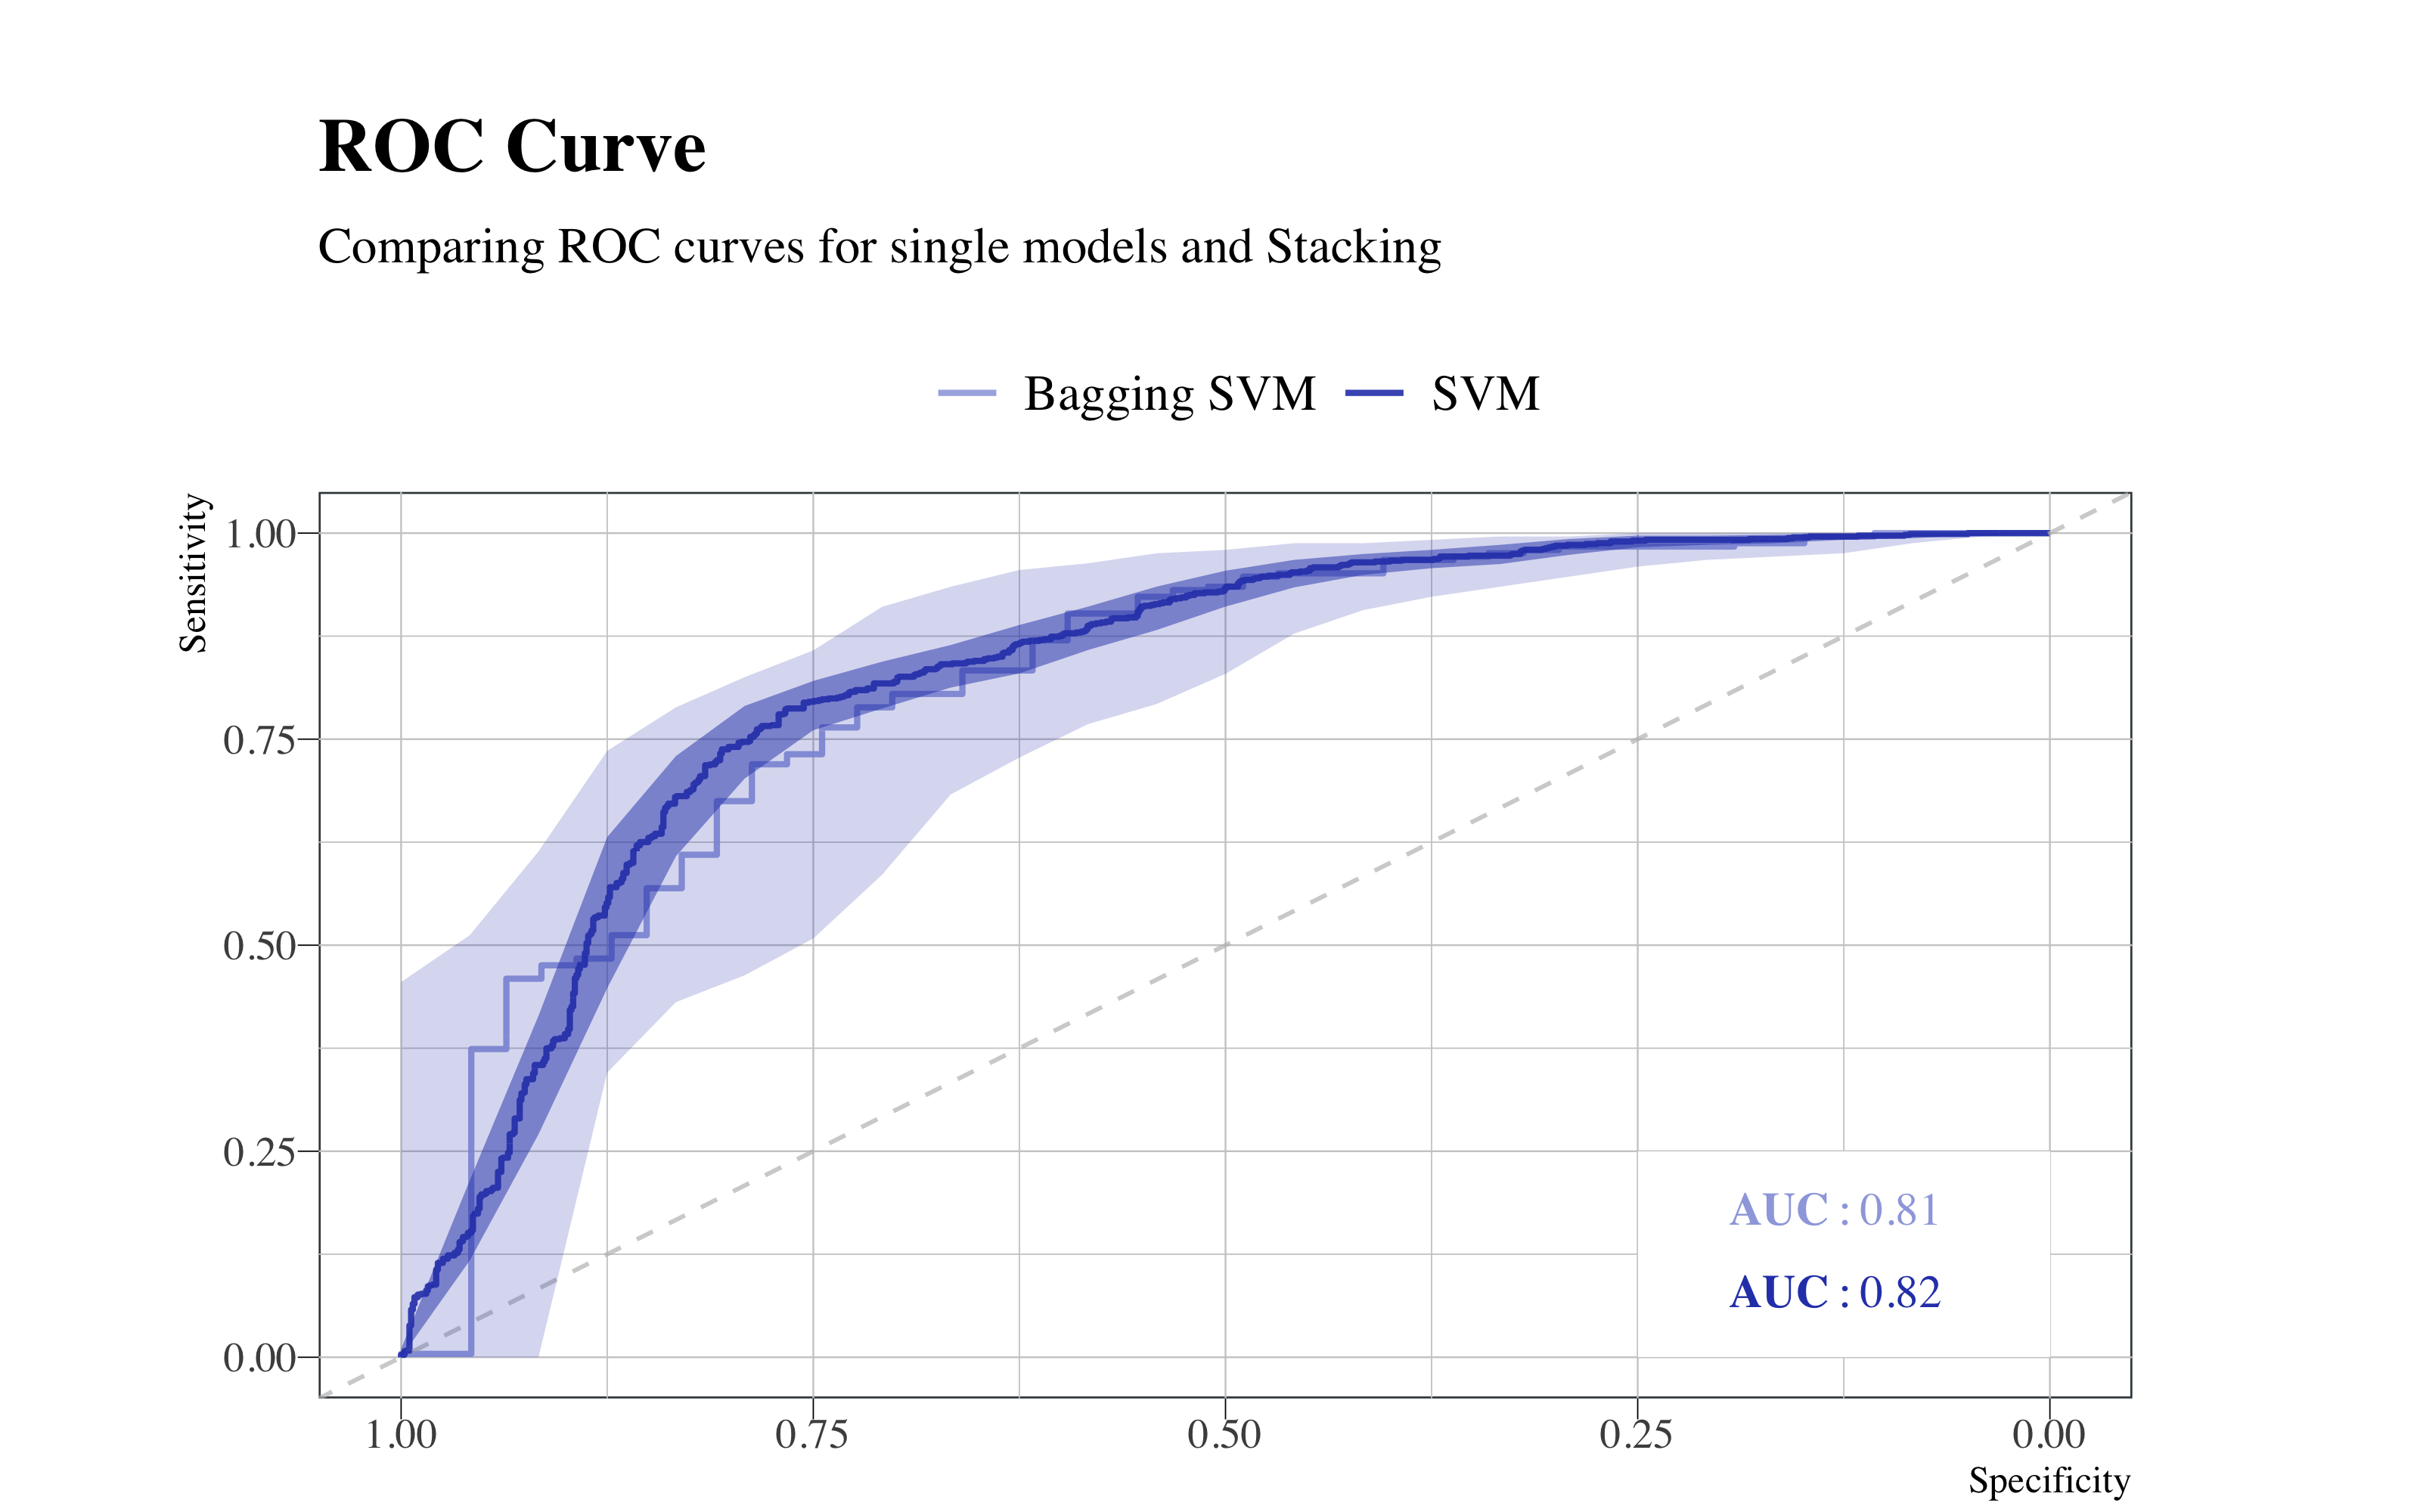
Se puede observar que, aunque los valores de la área abajo de la curva ROC están parecidos, el modelo ensemble no aporta mejorías a el modelo simple.
4.10 Boosting
Para realizar el boosting el flujo de trabajo es parecido a los demás. Se empieza con el tuneo.
4.10.1 Tuneo del Modelo
registerDoParallel(makeCluster(3) -> cpu)
tic()
set.seed(112)  # for reproducibility
boost_result <- train(factor(attrition) ~ ., data = upTrain2, method = "AdaBoost.M1",
    verbose = FALSE, trainControl = control, tuneGrid = expand.grid(mfinal = c(3,
        5, 8, 10, 15, 30, 50, 100), maxdepth = c(1, 5, 10, 15, 30, 50), coeflearn = c("Breiman")))
toc()  #10.71 min elapsed
stopCluster(cpu)
Observamos en la tabla los resultados:
cbind(boost_result$bestTune, getTrainPerf(boost_result)) %>%
kable(format = "html", bootstrap_options = "basic", caption = "Best Tune", digits = 3)| mfinal | maxdepth | coeflearn | TrainAccuracy | TrainKappa | method | |
|---|---|---|---|---|---|---|
| 24 | 100 | 10 | Breiman | 0.966 | 0.932 | AdaBoost.M1 |
plot(boost_result, output = "ggplot", "line", par.settings = list(superpose.line = list(lwd = 1,
    col = c("#D6DBF5", "#B5BFE7", "#94A4D9", "#7388CC", "#526DBE", "#3252B1")), superpose.symbol = list(pch = 19,
    cex = 0.6, col = c("#D6DBF5", "#B5BFE7", "#94A4D9", "#7388CC", "#526DBE", "#3252B1")),
    strip.background = list(col = "#D6DBF5")))
Los números de weak learners parece establecer el error alrededor de 100. Un tamaño entre 10 y 30 parece ser necesario para alcanzar la máxima accuracy.
4.10.2 Modelo Final
boost <- train(factor(attrition) ~ ., data = upTrain2, method = "AdaBoost.M1", verbose = FALSE,
    trControl = control, tuneGrid = expand.grid(mfinal = c(100), maxdepth = c(10),
coeflearn = c("Breiman")))draw_confusion_matrix(confusionMatrix(boost$pred$pred, boost$pred$obs), "#D6DBF5",
"#2E45B8")
as_tibble(vip::vi(boost)) %>%
filter(Importance > 2.5) %>%
mutate(Variable = stringr::str_to_title(Variable)) %>%
mutate(Variable = str_replace_all(Variable, "_", " ")) %>%
ggplot(aes(x = reorder(Variable, Importance), y = Importance)) + ggchicklet::geom_chicklet(aes(fill = Importance),
radius = grid::unit(6, "pt"), width = 0.8, show.legend = F) + labs(x = NULL,
title = "Variable Importance Plot Boosting") + scale_y_continuous(position = "right") +
scale_fill_gradient(low = "#D6DBF5", high = "#2E45B8") + coord_flip() + hrbrthemes::theme_ipsum(base_family = "Times",
grid = "X") + theme(plot.title = element_text(vjust = -1), plot.margin = unit(c(0,
1, 1, 0.5), "cm"))

Boosting Modelo Final
El modelo es muy bueno, tiene un accuracy de 0.978 y una AUC de 0.993. También nos proporciona las importancias de las variables:
- El salario siempre está arriba las demás por importancia, aunque notamos con este conjunto restringido que los años total trabajos, los en la empresa y el numero de empresas por el cual has trabajo toman más importancia comparado a los modelos con todas las variables.
4.11 Stacking
Para realizar el stacking, he utilizado el paquete caretEnseble. Con este he tenido varios problemas al principio, sobre todo por ajustar los modelos learners con los parámetros que quería. Al final he encontrado una solución:
- La función
caretStackadmite también modelos entrenados separadamente, solo si después se convierten en la claseas.caretList. - Para realizar el stacking es necesario establecer un control común para los varío modelos, que especifica los indexes de los folds de la validación cruzada, en cuanto tienen que ser comunes para todos los modelos.
- Se entrenan los modelos con
traincomo siempre, tuneando o fijando los parámetros óptimos si ya se conocen y se juntan en una listaas.caretList. - Al final se realiza el stacking sobre esta lista, decidiendo el algoritmo para realizar el ensemble y es posible tunearlo. Aquí también es importante especificar el indice con la respectiva variable dependiente.
library("caretEnsemble")

stck_control <- trainControl(method = "cv", number = 5, returnResamp = "all", savePredictions = "all",
    classProbs = TRUE, index = createMultiFolds(upTrain2$attrition, 5))

# Entrenamos
gbm_stck <- train(factor(attrition) ~ ., data = upTrain2, method = "gbm", trControl = stck_control,
    tuneGrid = expand.grid(shrinkage = c(1), n.minobsinnode = c(35), n.trees = c(10000),
        interaction.depth = c(2)), distribution = "bernoulli", bag.fraction = 1,
    verbose = FALSE)

svmR_stck <- train(factor(attrition) ~ ., data = upTrain2, method = "svmRadial",
    trControl = stck_control, tuneGrid = expand.grid(C = c(30), sigma = c(1)), verbose = FALSE)

xgbm_stck <- train(factor(attrition) ~ ., data = upTrain2, method = "xgbTree", trControl = stck_control,
    tuneGrid = expand.grid(eta = c(0.05), min_child_weight = c(35), nrounds = c(10000),
        gamma = c(0), subsample = c(1), max_depth = c(6), colsample_bytree = c(1)),
    verbose = FALSE)

model_list = as.caretList(list(xgbm = xgbm_stck, svm_rad = svmR_stck, gbm = gbm_stck))

# Stacking
stacking <- caretStack(model_list, method = "gbm", verbose = FALSE, metric = "ROC",
    tuneGrid = expand.grid(shrinkage = c(0.5, 1), n.minobsinnode = c(15, 35, 50),
        n.trees = c(5000, 10000), interaction.depth = c(2)), trControl = trainControl(method = "cv",
        number = 5, savePredictions = "final", classProbs = TRUE, index = createResample(upTrain2$attrition)))
Vemos una curva ROC para comparar los resultados:
list(`SVM Rad` = roc(svmR_stck$pred$obs, svmR_stck$pred$Yes), GBM = roc(gbm_stck$pred$obs,
    gbm_stck$pred$Yes), XGBM = roc(xgbm_stck$pred$obs, xgbm_stck$pred$Yes), Stacking = roc(stacking$ens_model$pred$obs,
    stacking$ens_model$pred$Yes)) %>%
    ggroc(size = 0.7, alpha = 0.9) + scale_color_manual(name = NULL, values = c(`SVM Rad` = "#2E45B8",
    GBM = "#6677CC", XGBM = "#9EA9E0", Stacking = "#D6DBF5")) + hrbrthemes::theme_ipsum(ticks = T,
    base_family = "Times", base_size = 10) + labs(title = "ROC Curve", subtitle = "Comparing ROC curves for single models and Stacking") +
    ylab("Sensitivity") + xlab("Specificity") + annotate("rect", xmin = 0.25, xmax = 0,
    ymin = 0, ymax = 0.37, fill = "white") + annotate("text", x = 0.13, y = 0.26,
    label = "bold(AUC): 0.99", colour = "#2E45B8", family = "Times", parse = TRUE) +
    annotate("text", x = 0.13, y = 0.19, colour = "#6677CC", label = "bold(AUC): 0.99",
        family = "Times", parse = TRUE) + annotate("text", x = 0.13, y = 0.12, colour = "#9EA9E0",
    label = "bold(AUC): 0.96", family = "Times", parse = TRUE) + annotate("text",
    x = 0.13, y = 0.05, colour = "#D6DBF5", label = "bold(AUC): 0.51", face = "bold",
    family = "Times", parse = TRUE) + theme(aspect.ratio = 0.5, plot.margin = unit(c(1,
    1, 0.1, 0.1), "cm"), legend.title = element_blank(), legend.text = element_text(size = 10),
    legend.position = "top", panel.background = element_rect(color = "#3b454a"),
    title = element_text(face = "bold"))
Como se puede observar de este gráfico comparativo de las curvas ROC, el stacking no ha aportado mejoras a los modelo solos.
Además se puede notar que los modelos de GBM y XGBM, esta vez ajustados por el conjunto de datos con las variables más influyentes, son más precisos de los mismos ajustados con todas las variables.
Conclusion
En conclusión, observamos este gráfico con los distintos valores de accuracy según cada técnica.
data.frame(model = c("Stacking", "Bagging SVM", "SVM Lin", "XGboost", "SVM Poli",
    "GBM", "Boosting", "SVM Rad"), accuracy = c(47, 76, 77, 92, 95, 96, 98, 99)) %>%
    apex(type = "radialBar", height = 500, aes(x = model, y = accuracy)) %>%
    ax_labs(title = "Model accuracy for ML models", subtitle = "On selected variables based on overall importance.\nClick on the bar to see results") %>%
    ax_title(style = list(fontSize = "19px")) %>%
    ax_subtitle(style = list(fontSize = "14px", color = "#BDBDBD")) %>%
    ax_colors(painter::Palette("#D6DBF5", "#3252B1", 10))
El modelo ganador ha sido el SVM Radial con un accuracy del 99% aunque el Boosting está justo detrás con 98%.
Referencías
[1] E. Alfaro, M. Gámez, and N. Garc'ia. “adabag: An R Package for Classification with Boosting and Bagging”. In: Journal of Statistical Software 54.2 (2013), pp. 1-35. URL: http://www.jstatsoft.org/v54/i02/.
[2] Alfaro, E. Gamez, Matias, Garcia, et al. adabag: Applies Multiclass AdaBoost.M1, SAMME and Bagging. R package version 4.2. 2018. URL: https://CRAN.R-project.org/package=adabag.
[3] L. Breiman, A. Cutler, A. Liaw, and M. Wiener. randomForest: Breiman and Cutler’s Random Forests for Classification and Regression. R package version 4.6-14. 2018. URL: https://www.stat.berkeley.edu/~breiman/RandomForests/.
[4] T. Chen, T. He, M. Benesty, V. Khotilovich, et al. xgboost: Extreme Gradient Boosting. R package version 1.5.2.1. 2022. URL: https://github.com/dmlc/xgboost.
[5] M. Corporation and S. Weston. doParallel: Foreach Parallel Adaptor for the parallel Package. R package version 1.0.16. 2020. URL: https://CRAN.R-project.org/package=doParallel.
[6] Z. A. Deane-Mayer and J. E. Knowles. caretEnsemble: Ensembles of Caret Models. R package version 2.0.1. 2019. URL: https://github.com/zachmayer/caretEnsemble.
[7] B. Greenwell, B. Boehmke, J. Cunningham, and G. Developers. gbm: Generalized Boosted Regression Models. R package version 2.1.8. 2020. URL: https://github.com/gbm-developers/gbm.
[8] M. Kuhn. caret: Classification and Regression Training. R package version 6.0-91. 2022. URL: https://github.com/topepo/caret/.
[9] A. Liaw and M. Wiener. “Classification and Regression by randomForest”. In: R News 2.3 (2002), pp. 18-22. URL: https://CRAN.R-project.org/doc/Rnews/.
[10] D. Meyer, E. Dimitriadou, K. Hornik, A. Weingessel, et al. e1071: Misc Functions of the Department of Statistics, Probability Theory Group (Formerly: E1071), TU Wien. R package version 1.7-9. 2021. URL: https://CRAN.R-project.org/package=e1071.
[11] X. Robin, N. Turck, A. Hainard, N. Tiberti, et al. “pROC: an open-source package for R and S+ to analyze and compare ROC curves”. In: BMC Bioinformatics 12 (2011), p. 77.
[12] X. Robin, N. Turck, A. Hainard, N. Tiberti, et al. pROC: Display and Analyze ROC Curves. R package version 1.18.0. 2021. URL: http://expasy.org/tools/pROC/.
[13] T. Therneau and B. Atkinson. rpart: Recursive Partitioning and Regression Trees. R package version 4.1-15. 2019. URL: https://CRAN.R-project.org/package=rpart.
[14] H. Wickham. ggplot2: Elegant Graphics for Data Analysis. Springer-Verlag New York, 2016. ISBN: 978-3-319-24277-4. URL: https://ggplot2.tidyverse.org.
[15] H. Wickham, W. Chang, L. Henry, T. L. Pedersen, et al. ggplot2: Create Elegant Data Visualisations Using the Grammar of Graphics. R package version 3.3.5. 2021. URL: https://CRAN.R-project.org/package=ggplot2.
Un Trabajo desarrollado por Alessio Crisafulli Carpani
